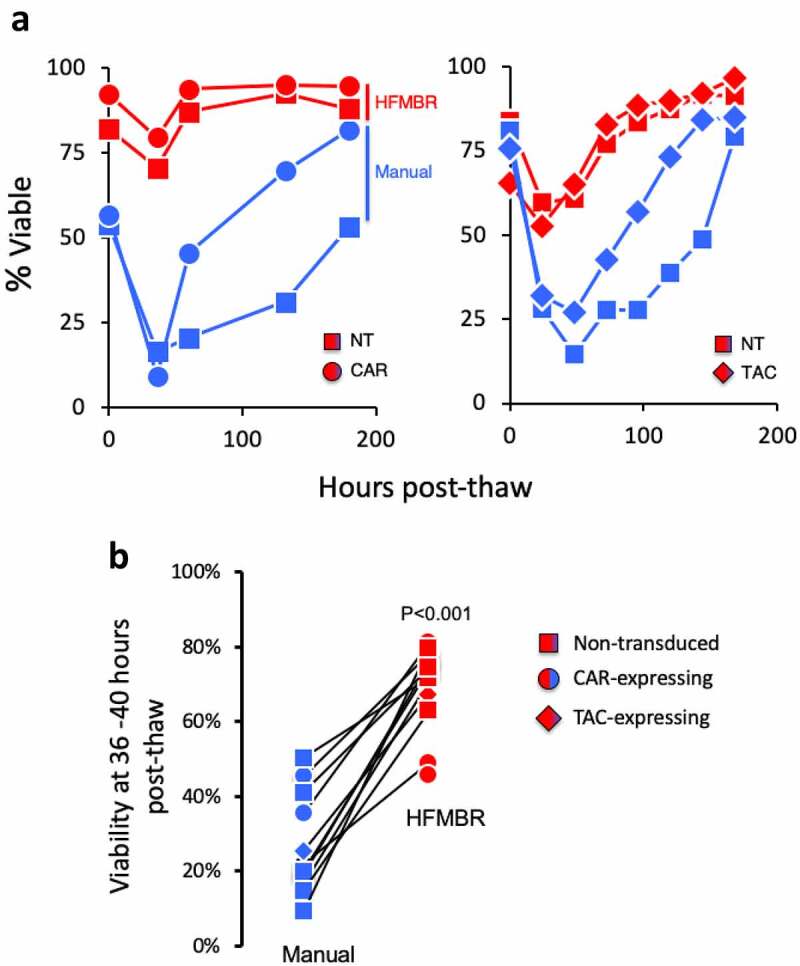
Figure 5.

T cells manufactured using the HFMBR display elevated viability post-thaw. Panel A. PBMC were manufactured using either the manual method or the HFMBR method. At the end of the manufacturing period, all T cell products were cryopreserved in CryoStor® CS10 for the same period of time. Subsequently, the T cells thawed and cultured in the presence of cytokines and viability was monitored. Panel A. The viability of cryopreserved T cells from two independent manufacturing runs using different donors were monitored over a period of 200 hours. Each graph represents an independent experiment. Panel B. T cells from an additional 12 manufacturing runs were treated as in panel A and viability was assessed between 36–40 hrs post-thaw. HER2-CAR T cells are shown as circles, CD19-TAC T cells are shown as diamonds and non-transduced T cells are shown as squares. Cells manufactured in the HFMBR are shown in red, cell manufactured using the manual method are shown in blue. A total of 22 T cell products were thawed to generate these results. These data represent 7 independent thawing experiments using T cell products from 3 donors that were processed in 4 independent manufacturing runs. P-value was determined using a paired Students t-test
