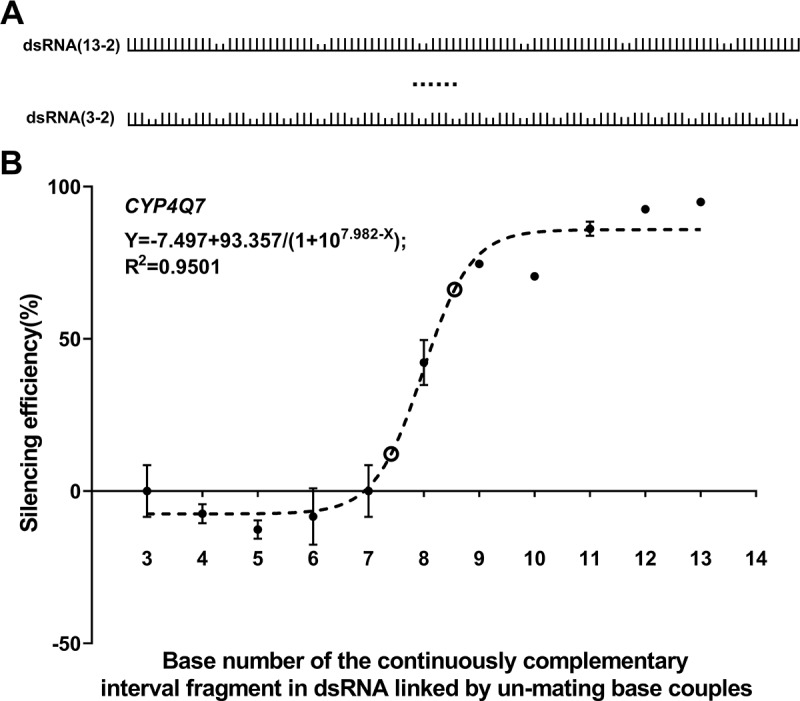
Figure 4.

Knockdown induced by dsCYP4Q7 containing evenly distributed mismatching base couples in T. castaneum. (A) The distribution model of the mismatching base couples in the sequence. The tall bars standing on the line represent matching bases between the target gene and dsRNA, and the adjoin short bars standing on the line represent mismatching base couples. (B) Knockdown of CYP4Q7 gene triggered by dsRNA containing evenly distributed mismating base couples at varying intervals. The circle represents the location of coordinate points with the largest slope change. Coordinate points (bp length, per cent depletion) was (7.4, 12.2) and (8.6, 66.2), calculated using the formula deriv(derivn(−7.497 + 93.357/(1 + 107.982-x), x, 2), x) = 0
