Figure 3.
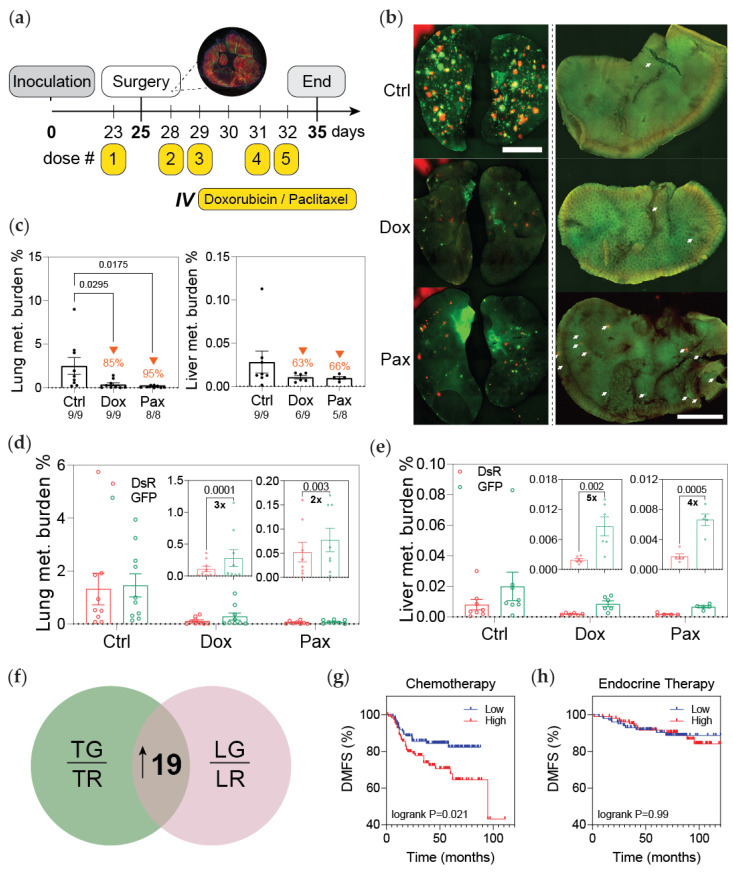
Post-hypoxic cells are less sensitive to doxorubicin and paclitaxel. (a) Schematic depicting the experimental set-up: primary tumors were surgically resected 25 days post implantation following one IV dose of neoadjuvant chemotherapy. Three days after surgery, the mice were treated with four doses of chemotherapy; mice were sacrificed 3 days following treatment. (b) Whole mount fluorescent image of lung (left) and liver (right) from one representative mouse per treatment group. (c) Percentage of fluorescent (DsRed+ and GFP+) cells measured by flow cytometry analysis (orange arrows indicate the decrease in metastatic burden compared to the control group). The ratio of mice with detectable metastasis over the total number in the treatment group is displayed for each condition. (d,e) The percentage of DsRed+ or GFP+ cells in the lung (d) and liver (e) as measured by flow cytometry (n = 8–9); p-value is displayed to compare GFP versus DsRed (one-tailed paired t-test). Insets show a reduced y-axis scale for doxorubicin and paclitaxel treatments. (f) Venn diagram displaying the 19 genes upregulated in both GFP+ (TG) versus DsRed+ (TR) tumor cells and GFP+ (LG) versus DsRed+ (LR) metastatic cells in the lung termed ‘hypoxic memory’ previously reported [25]. (g,h) Microarray expression data were used to perform Kaplan–Meier analysis of distant metastasis-free survival (DMFS) of breast cancer patients stratified by high or low expression of the ’hypoxic memory’ 19-gene signature and treated with either (g) chemotherapy (N = 225) or (h) endocrine therapy (N = 205).

