
Figure 1.
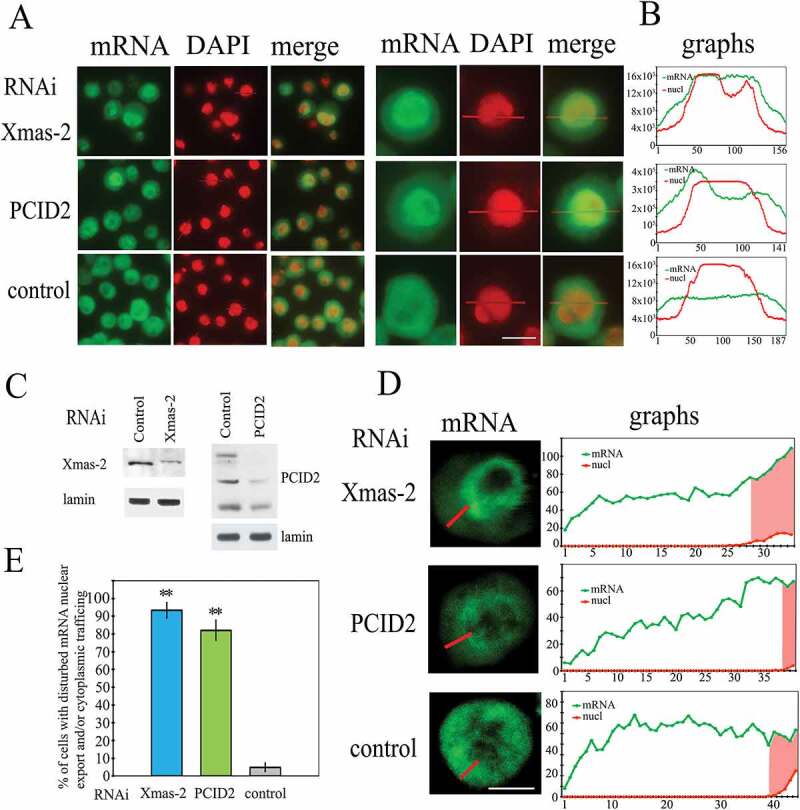
The effect of the RNAi-mediated knockdown of PCID2 and Xmas-2 on the poly(A) RNA distribution in S2 cells
(a) The distribution of mRNA in control, Xmas-2, and PCID2 RNAi knockdown in S2 cells. The poly(A) RNA was stained using a fluorescent-labelled oligo dT probe. Cells were co-stained with DAPI to visualize nuclei. Note that here and in the figures below, for better visualization of merged images, DAPI was pseudo-coloured in red. The fluorescent microscope images of the fields with several cells and the image of one representative cell are shown. Scale bar here and on other images, 10 µm. (b) Quantitation of the level of fluorescent signal in the corresponding cell was performed using ImageJ program. The intensity of the signal (Y-axis) in each point (x-axis) is demonstrated. Red graphs show the distribution of DAPI signal, while green graphs indicate the distribution of the oligo dT signal. The larger fields with signal quantification are shown in Supplementary Fig. 1. (c) The levels of Xmas-2 and PCID2 proteins in the RNAi knockdown cells. (d) The confocal microscopy images of single representative cells and quantification of the level of fluorescent signal in their cytoplasm performed using the ImageJ program. Green graphs indicate the distribution of oligo dT signal; the nuclei on the graphs are shown in red. (e) The percentages of cells with affected mRNA nuclear export (Xmas-2), or nuclear export and mRNA trafficking (PCID2). In control, knockdown cells, with both nuclear export and trafficking defects were calculated. Each RNAi knockdown experiment was performed in four replicates. About 300 cells were examined in blind count in each of the replicates, and the mean value was calculated. Error bars represent SD for at least three independent experiments. All data are presented as means ± SD, and Student’s t-test was used to compare the control and treatment groups. An asterisk (*) indicates the statistical significance with p-value < 0.05; (**) indicates the statistical significance with p-value < 0.01.