
Figure 5.
The effect of NudC knockdown on PCID2 stability and mRNA transport
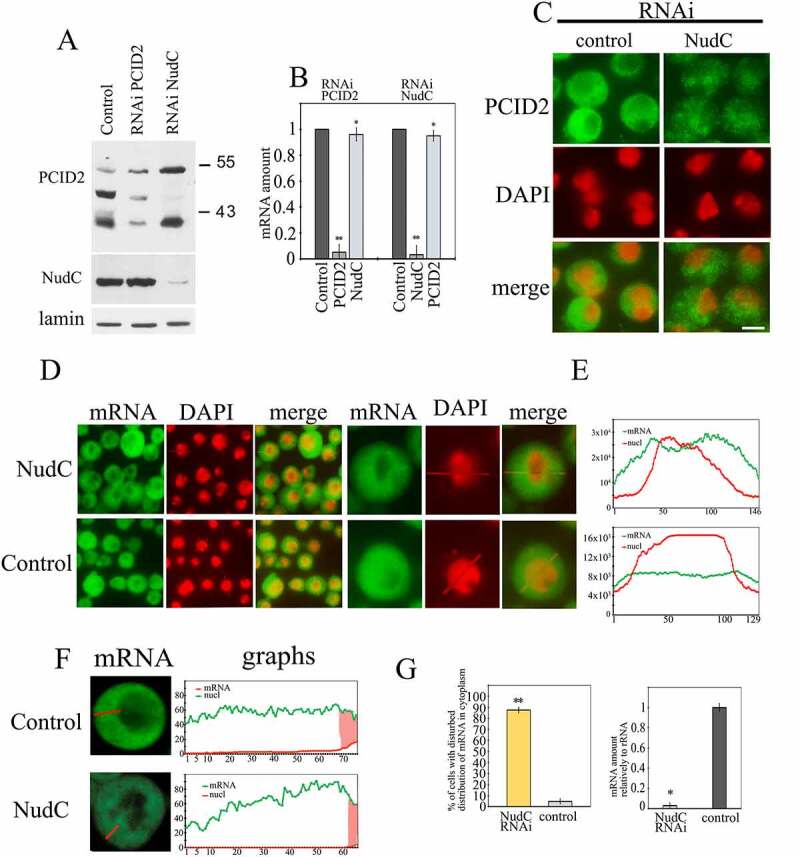
The RNAi knockdown of NudC or control RNAi with GFP fragment was performed in S2 cells. (a) Western-blot demonstrates the level of PCID2 and NudC in the control, PCID2, or NudC RNAi knockdown S2 cells. The PCID2 and NudC were detected in the protein extracts using the corresponding antibodies. Lamin was used as a loading control. (b) The level of PCID2 and NudC transcripts in control RNAi, PCID2 RNAi knockdown, or NudC RNAi knockdown. Expression level was normalized to that in the control knockdown. Error bars represent SD for at least three independent experiments. All data are presented as means ± SD, and Student’s t-test was used to compare the control and treatment groups. An asterisk (*) indicates the statistical significance with p-value < 0.05; (**) indicates the statistical significance with p-value < 0.01. (c) Control and NudC RNAi S2 cells were immunostained with anti-PCID2 antibodies and fluorescent secondary antibodies, and co-stained with DAPI (pseudo-collored in red). Scale bar, 10 μm. The larger fields are shown in Supplementary Fig. 3e. (d–g) The effect of NudC knockdown on poly(A) mRNA distribution in the cell. The poly(A) RNA was stained using a fluorescent-labelled oligo dT probe. (d) The fluorescent microscope images of the fields with several cells and the image of one representative cell are shown. (e) Quantitation of the level of fluorescent signal performed using the ImageJ program. The intensity of the signal (Y-axis) in each point (x-axis) is shown. Red graphs show the distribution of DAPI signal, while green graphs indicate the distribution of oligo dT signal. The larger fields are shown in Supplementary Fig. 4. (f) The confocal microscopy images of single representative cell and quantitation of the level of fluorescent signal in cytoplasm performed using the ImageJ program. Green graphs indicate the distribution of oligo dT signal; the nuclei are shown in red. Scale bar, 10 µm. (g) The percentages of cells with damaged mRNA trafficking (left panel). Each RNAi knockdown experiment was performed in four replicates. About 300 cells were examined in blind count in each of the replicates, and the mean value was calculated. The efficiency of NudC knockdown (the level of corresponding transcripts) is demonstrated on the right panel. The level of each transcript in the knockdown cells relative to the control cells is shown. The level of transcription was normalized against the ribosomal RNA. Error bars represent SD for at least three independent experiments. All data are presented as means ± SD, and Student’s t-test was used to compare the control and treatment groups. An asterisk (*) indicates the statistical significance with p-value < 0.05; (**) indicates the statistical significance with p-value < 0.01.