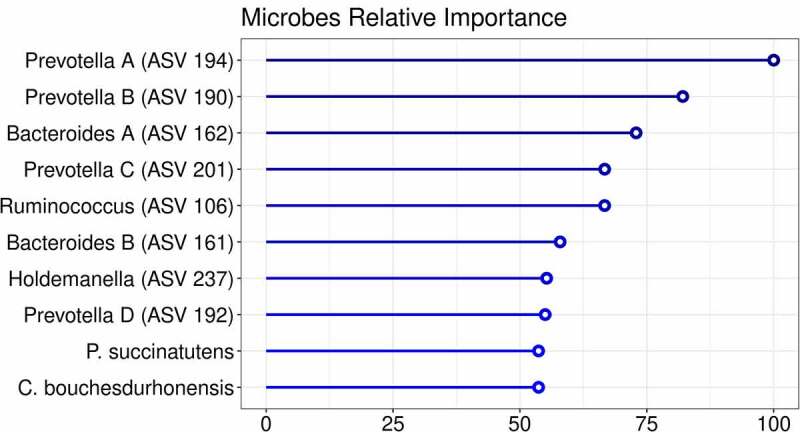
Figure 2.

Importance plot showing the significant associations in the microbial panel that differentiate between changes upon autologous FMT versus changes upon allogenic FMT. The y-axis represents the top 10 most predictive microbial markers. The x-axis shows the relative importance of these microbial markers based on the permutation importance measure normalized between 0 to 100%. The color represents the largest change upon either autologous FMT (red) or allogenic FMT (blue)
