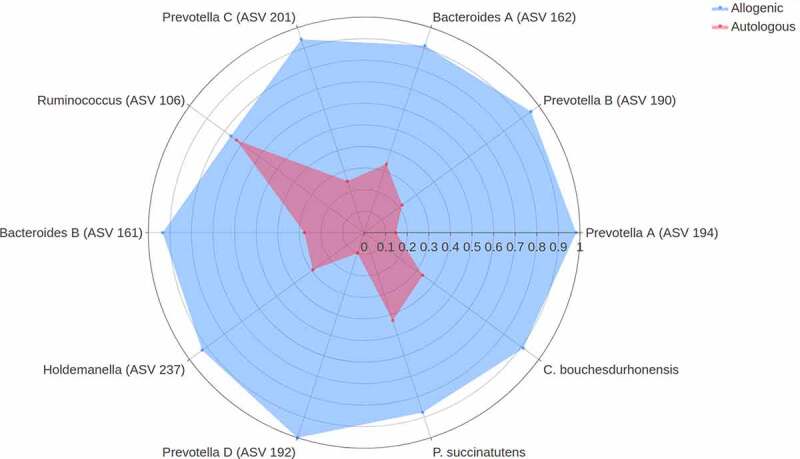
Figure 3.

Spider plot depicting a panel of microbes that significantly differentiate between changes upon autologous FMT (red) versus changes upon allogenic FMT (blue). The axis of the spider plot represents the mean scaled changes for the top 10 most discriminative microbial markers. The microbial markers are based on 16s rRNA gene sequencing. Note that more ASVs belonging to the Prevotella and Bacteroides genus were identified and an alphabetical letter was added for the distinction between these ASVs
