
Figure 7.
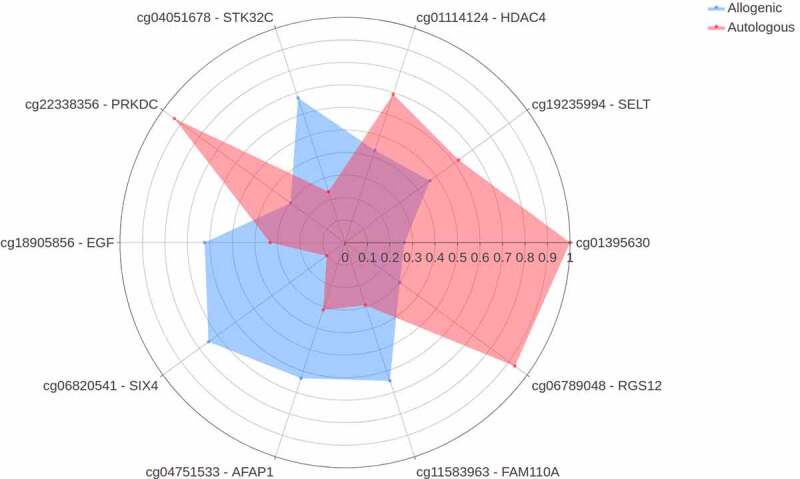
Spider plot depicting a panel of DNA methylation loci that significantly differentiate between changes upon autologous FMT (red) versus changes upon allogenic FMT (blue). The axis of the spider plot represents the mean scaled changes for the top 10 most discriminative loci