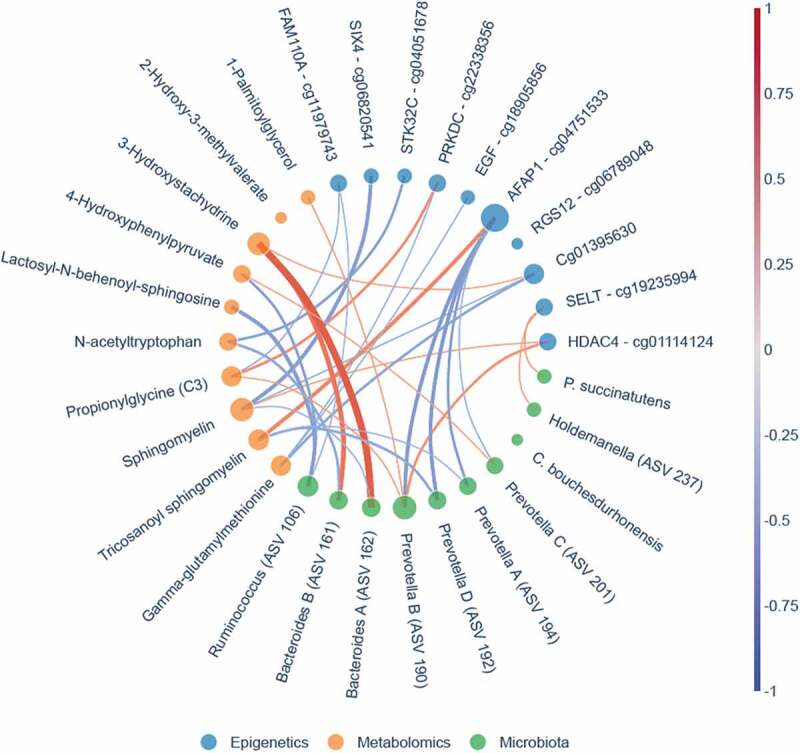
Figure 8.

Bokeh network graph on multi-omics showing correlations between the three different panels. The top 10 most discriminative predictive markers of the microbial panel (green nodes), metabolite panel (Orange nodes) and epigenetics panel (blue nodes) are displayed. Lines between the different nodes represent Spearman correlations. A red line represents a strong positive correlation, whereas the blue line represents a strong inverse correlation. The thickness of the line represents the degree of the correlation. The size of the node is dependent on the number of correlations where more correlations lead to larger nodes. The microbial markers are based on 16s rRNA gene sequencing. Note that more ASVs belonging to the Prevotella and Bacteroides genus were identified and an alphabetical letter was added for the distinction between these ASVs
