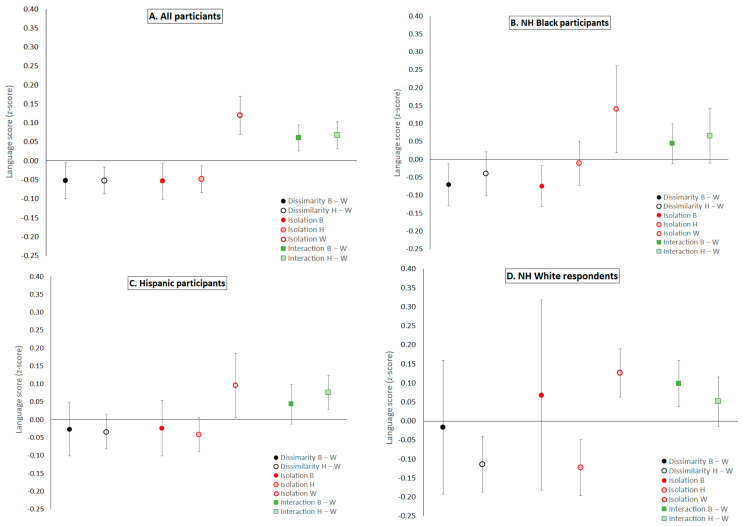
Figure 3.
Association of residential segregation indices and language scores for the whole sample (A) and three race/ethnicity groups (B–D), which were derived from models with a segregation index x ace/ethnicity interaction (estimates in Table 2 and Table 3). The models controlled for age, sex/gender, race/ethnicity, childhood socioeconomic position, years of education, occupation, language of test administration, birthplace, and recruitment cohort. For all indices, we used the mean value within our sample to create binary indicators of segregated census blocks. Higher dissimilarity and isolation indicate a block group with more people from minoritized backgrounds, whereas higher interaction indicates more desegregated areas. Note: confidence intervals for effect of living in census blocks where the majority of residents are NH Black adults (isolation B and dissimilarity B-W) on NH White respondents (panel D) have large confidence intervals due to small sample sizes (n = 14 and n = 43, respectively).

