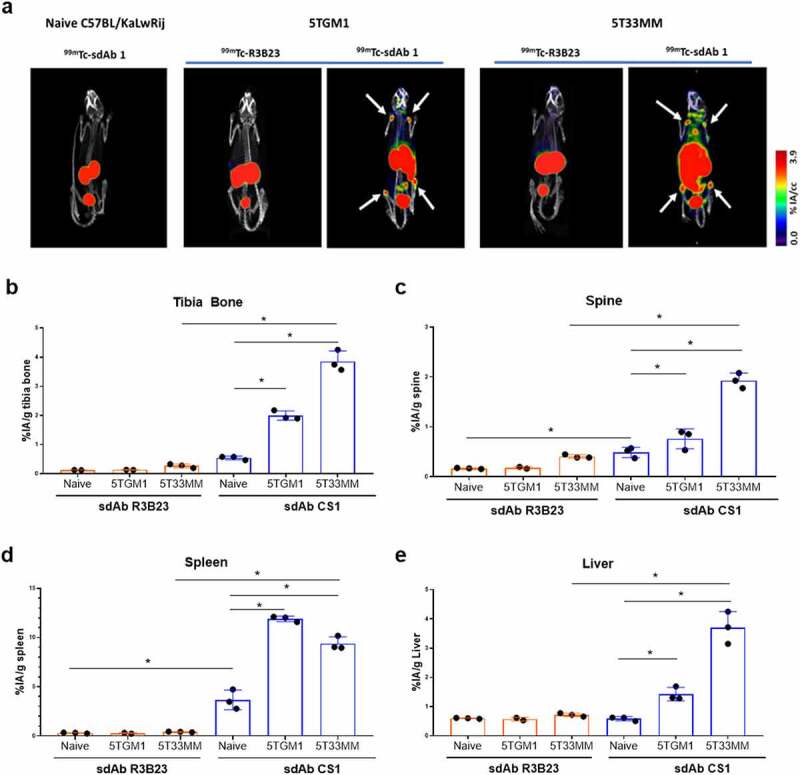
Figure 3.

Biodistribution of CS1-specific sdAbs in naive, 5TGM1 and 5T33MM mice. (a) µSPECT/CT images 1 h.p.i. of 99mTc-labeled sdAb1 in naive mice, 5TGM1 (moderate model) and 5T33 (aggressive model) MM mice. One representative picture (n = 3/sdAb/model). White arrows indicate bone uptake. (b-e) Organs were dissected and radioactivity was measured in bone, spine, spleen and liver (n = 3/sdAb). Data is presented as mean±SD percentage injected activity per gram organ or tissue (%IA/g).*p < .05, Mann-Whitney U test
