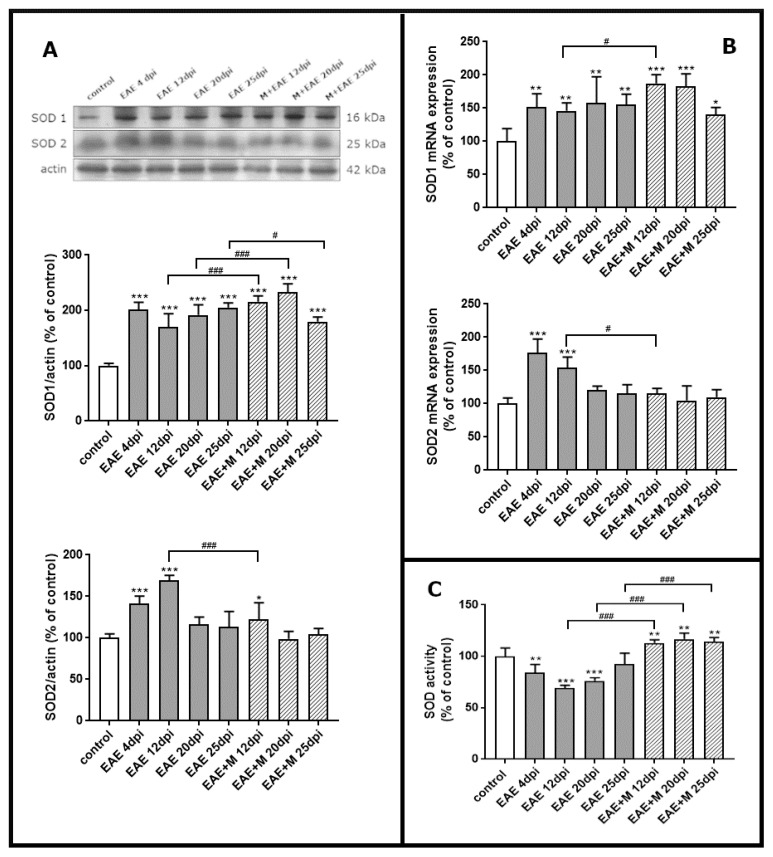
Figure 3.
The expression of superoxide dismutases SOD1 and SOD2 in the brain of control and experimental autoimmune encephalomyelitis (EAE) rats at different times post-immunization and after therapeutic treatment with memantine. Representative immunoblots and bars showing the relative levels of enzymatic protein (A), bars showing the expression of enzymatic mRNA (B), and bars showing the total activity of SODs enzymes (C). The results are the means from n = 4 animals in each group and are expressed as a percentage of control. * p < 0.05; ** p < 0.01; *** p < 0.001 significantly different vs. control rats; # p < 0.05, ### p < 0.01 significantly different vs. EAE rats not subjected to therapy. (one-way ANOVA followed by Bonferroni’s multiple comparison post-test).

