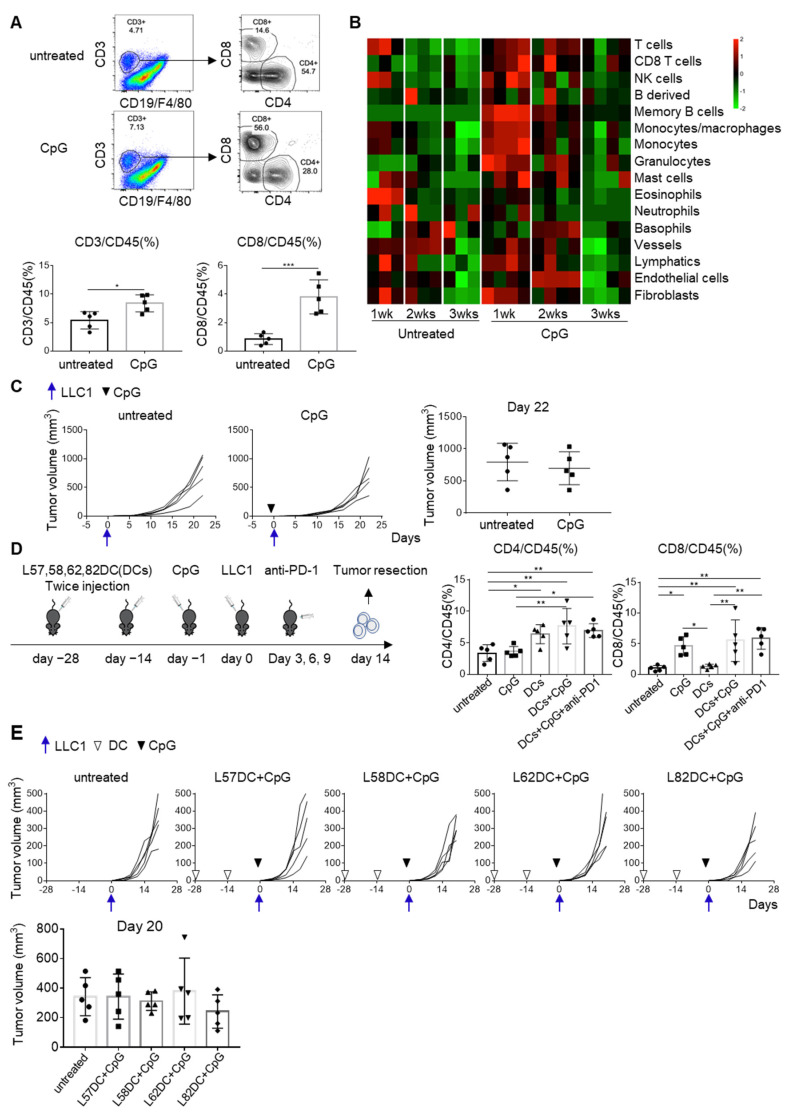
Figure 5.
CpG treatment turned cold tumors into hot. (A) CpG (30μg) was subcutaneously administered to C57BL/6 mice (n = 5) one day before 1×10⁶ LLC1 cells inoculation. Tumors were harvested on day 14 and tumor-infiltrating lymphocytes were analyzed by flow cytometry. (B) RNAs were extracted from days 7, 14, and 21 tumors and subjected to RNA-Seq. The composition of tumor-infiltrating immune cells was analyzed using the mMCP-counter. (C) C57BL/6 mice (n = 5) were either treated with 30μg CpG or left untreated, and LLC1 tumor growth was evaluated. (D) C57BL/6 mice were divided into five groups (five mice per group): (1) untreated; (2) CpG treatment; (3) the mixture of L57, L58, L62, and L82 LP-pulsed DC (1 × 10⁶ each) vaccination; (4) the combination of DC vaccination and CpG; and (5) the triple combination of DC vaccination, CpG and anti-PD-1 mAb (200μg). Mice received DC vaccination on days −28 and −14. CpG was administered on day −1. Mice received anti-PD-1 mAb on days 3, 6, and 9 after the LLC1 challenge (1 × 10⁶). On day 14, tumors were resected and subjected to the analysis of tumor-infiltrating cells. CD4/CD45 (%): untreated vs. DCs (p = 0.0316), untreated vs. DCs+CpG (p = 0.0021), untreated vs. DCs+CpG+anti-PD-1 (p = 0.0096), CpG vs. DCs+CpG (p = 0.0035), CpG vs. DCs+CpG+anti-PD-1 (p = 0.0161); CD8/CD45 (%): untreated vs. CpG (p = 0.0199), untreated vs. DCs+CpG (p = 0.0038), untreated vs. DCs+CpG+anti-PD-1 (p = 0.0018), CpG vs. DCs (p = 0.0336), DCs vs. DCs+CpG (p = 0.0066), DCs vs. DCs+CpG+anti-PD-1 (p = 0.0032). (E) Tumor growth was compared in these five groups. * p < 0.05, ** p < 0.01, *** p < 0.001.

