
FIG 1.
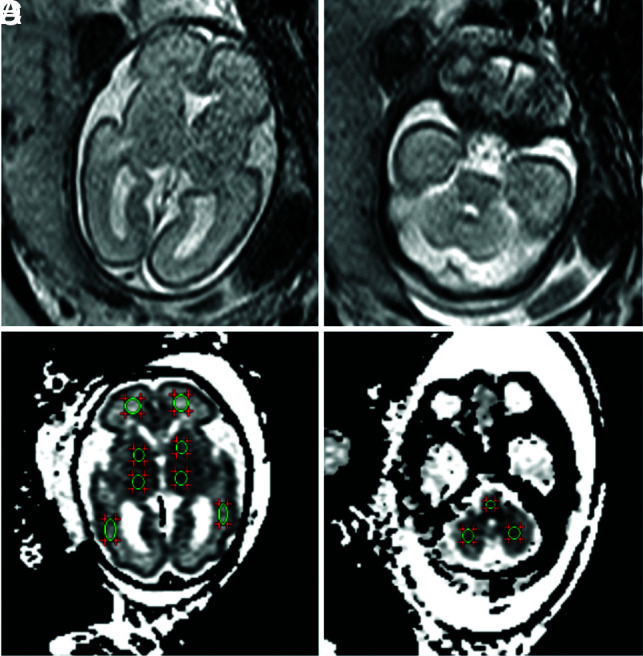
ADC map in a fetus at 26 weeks’ GA showing ROIs in the different regions. A and B, T2WI. C and D, The same GA, DWI. Pair-wise ADC values of the ROIs are manually delineated on each side of the frontal WM, periatrial WM, basal ganglia, thalamus, and cerebellar hemisphere, as well as a single measurement in the pons.