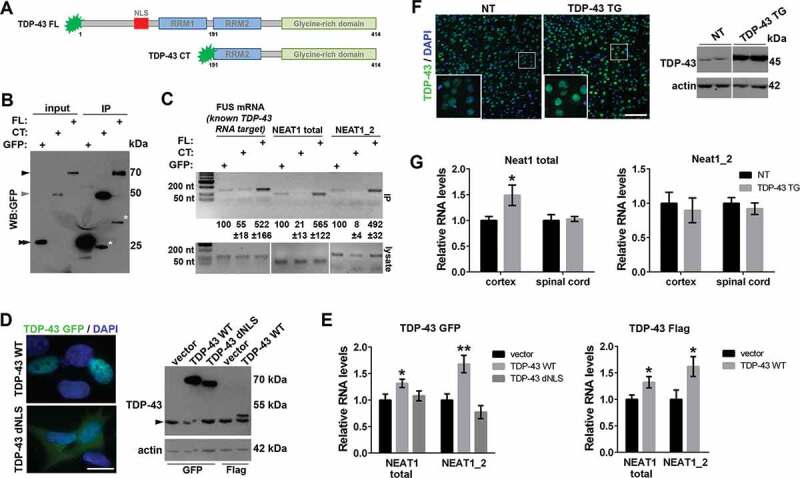
Figure 1.

Overabundance of human full-length TDP-43 leads to NEAT1 upregulation in cultured cells and in the cortex of transgenic mice
(A) TDP-43 species used in the study: full-length (FL) human TDP-43 and C-terminal TDP-43 fragment (CT, aa. 192–414).
(B,C) TDP-43 FL but not TDP-43 CT binds to NEAT1 in cultured cells. RNA immunoprecipitation (IP) was performed using GFP®Trap beads in SH-SY5Y cells transfected to express GFP-tagged TDP-43 FL or TDP-43 CT. For input, 1/10 of the cell lysate was used. Asterisk indicates non-specific or cleavage fragments detected by the anti-GFP antibody. Black and grey arrowheads indicate GFP-tagged FL and CT TDP-43, respectively, and double arrowhead – GFP (B). The presence of NEAT1 (NEAT1 total: NEAT1_1 and NEAT1_2 isoforms combined; and NEAT1_2 only) in IP samples and cell lysates was detected by RT-PCR. Quantification of band intensities in IP samples is also given (mean±SEM, n = 3). A known TDP-43 mRNA target, FUS, was included as a positive control. PCR fragment sizes are as follows: NEAT1 total, 91 nt; NEAT1_2, 141 nt; FUS, 145 nt (C). Representative western blot and PCR gels are shown.
(D,E) Overexpression of wild-type TDP-43 but not TDP-43 lacking NLS (dNLS) upregulates NEAT1 in a stable cell line. SH-SY5Y cells were analysed 24 h post-transfection with a respective construct. TDP-43 was tagged with either GFP or Flag. Vector corresponds to pEGFP-C1. In D, subcellular localization of GFP-tagged TDP-43 variants and a representative western blot with an anti-TDP-43 antibody are shown. Arrowhead indicates the endogenous TDP-43 band. Scale bar, 10 µm. In E, qRT-PCR results for total NEAT1 and NEAT1_2 levels are shown; data represent mean±SEM, n = 4, *p < 0.05, **p < 0.01 (Mann-Whitney U test).
(F,G) NEAT1 upregulation in the cortex of TDP-43PrP mice. Increased TDP-43 level in the cortex of homozygous 4-week old TDP-43PrP mice [7], as compared to their non-transgenic (NT) littermates was confirmed by immunostaining and western blot (F). Note that high levels of TDP-43 (green) are detected in neurons (dim DAPI signal) but not in glial cells (bright DAPI signal). Scale bar, 100 µm. In G, NEAT1_2 and total NEAT1 levels were measured by qRT-PCR in the spinal cord and cortex lysates; data represent mean±SEM, n = 8, *p < 0.05 (Mann-Whitney U test).
