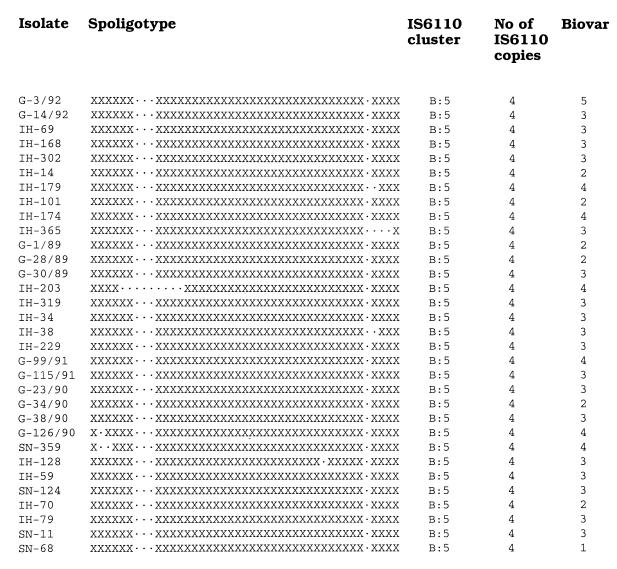
FIG. 3.
Schematic representation of spoligotypes of 32 M. tuberculosis isolates belonging to cluster B:5. The isolates are sorted in the same order in which they were sorted by their IS6110 RFLP patterns in Fig. 1. X, positive hybridization signals; dots, lack of hybridization.

