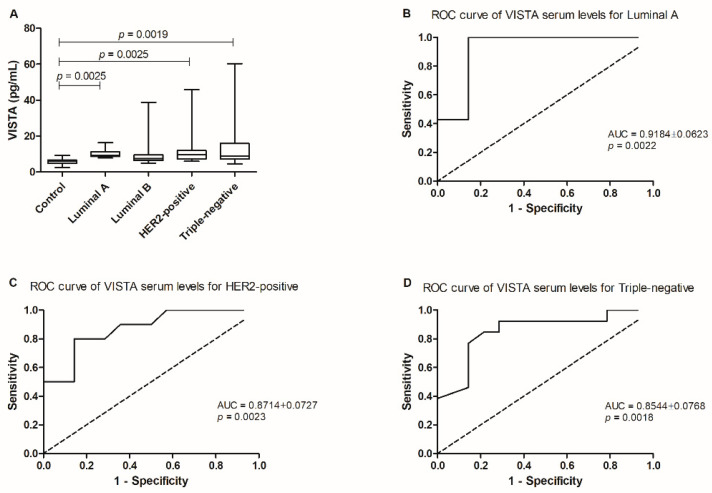
Figure 1.
Serum VISTA levels in the diseased population in the study by comparison to a control/healthy group. (A) Serum VISTA levels were higher in queens with luminal A (* p = 0.0025), HER2-positive (* p = 0.0025) and triple-negative (** p = 0.0019) tumor subtypes, when compared to the control group. (B) ROC curve analysis performed in tumor subtypes presenting the higher serum VISTA levels allowed the identification of an optimal cut-off value for cats diagnosed with luminal A; and the most aggressive, (C) HER2-positive; (D) and triple-negative carcinomas.

