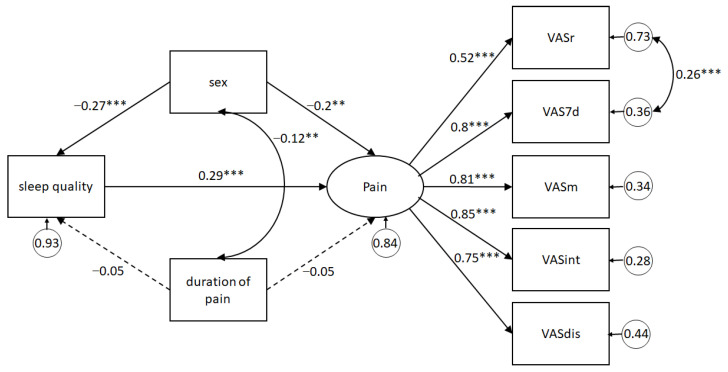
Figure 2.
Structural equation model predicting pain from sleep quality, controlling for sex and pain duration. Note: Statistics are standardized regression coefficients. Dotted lines represent non-significant relations; bold lines represent significant paths. The curve lines correspond to covariation between variables or their errors. VASr, VAS at rest; VAS7d, average VAS 7 days; VASm, VAS at movement; VASint, VAS pain interference; VASdis, VAS distress relative to pain. * p < 0.05, ** p < 0.01, *** p < 0.001.

