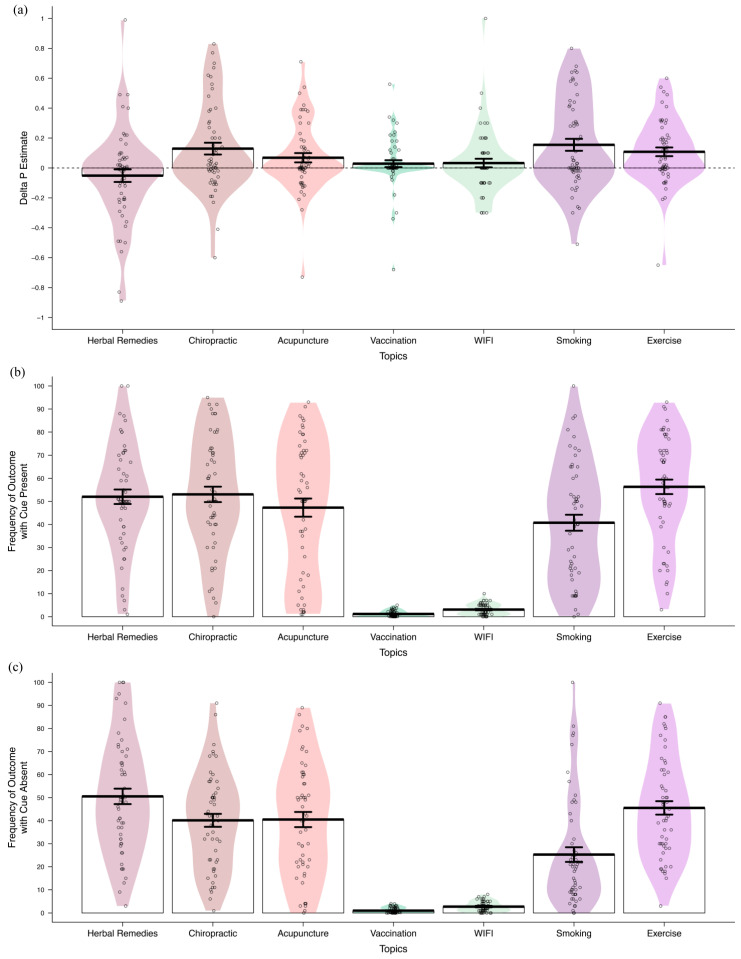
Figure 2.
(a) Delta p estimates for each target topic, measured as a difference in the probability of the outcome occurring in the presence and absence of the target health behaviour. (b) Reported frequency (from 0–100%) of the target outcome occurring in the presence of the cause, and (c) in the absence of the cause. Frequency estimates for autism were made from a scale of 0–5%, and cancer estimates were made from a scale of 0–10%. Coloured region denotes the density of the estimates along the Y-axis. Labels on the X-axis denotes the topic area by cue name. Delta p estimates were only calculated for participants who provided both outcome frequency estimates (with and without the cause present).

