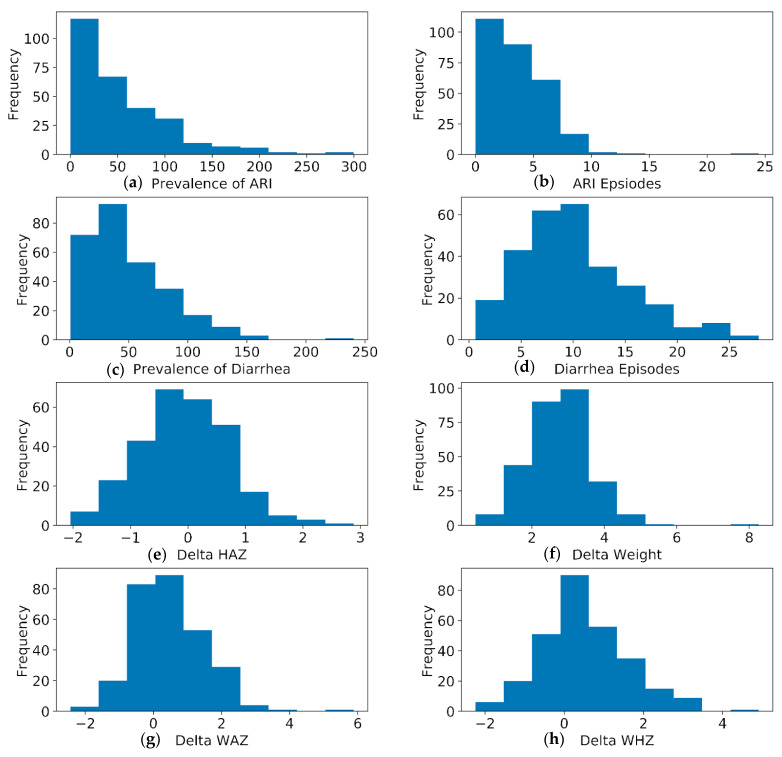
Figure 2.
Histogram explaining the distribution of anthropometric variables and prevalence variables. (a) Prevalence of acute respiratory infections (ARIs) (b) number of ARI episodes (c) Prevalence of diarrhea; (d) Number of diarrhea episodes (e) change (delta) height for age (HAZ) score (f) Change (delta) in weight (g) change (delta) weight for age (WAZ) score (h) Change (delta) in weight (g) change (delta) weight for height (WHZ) score.

