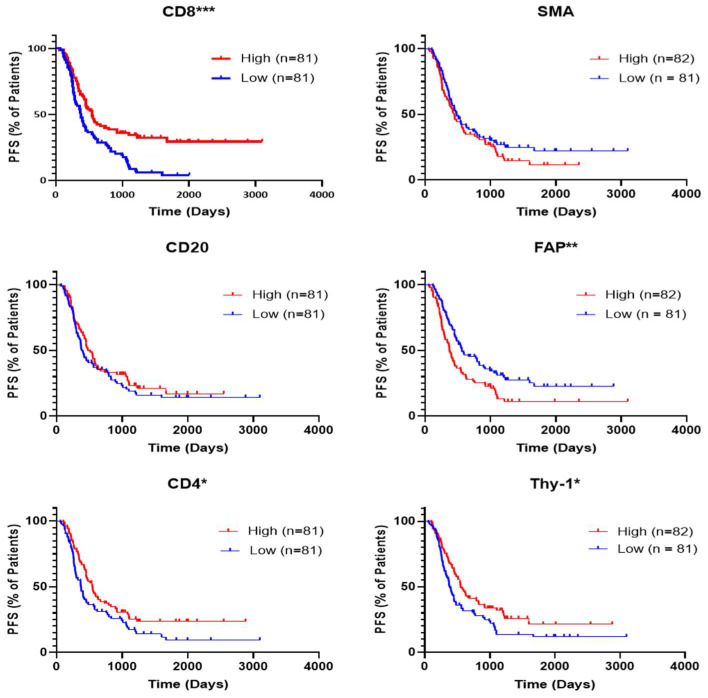
Figure 2.
Progression-free survival of patients in YTMA454 based on expression of TIL and CAF biomarkers. Representative Kaplan–Meier curves show the progression-free survival of different groups of patients in YTMA454. The median values of expression for each marker were used as the cutpoints to define high- and low-expressing patients. Abbreviations: PFS, progression-free survival; * p < 0.05; ** p < 0.01; *** p < 0.0001.

