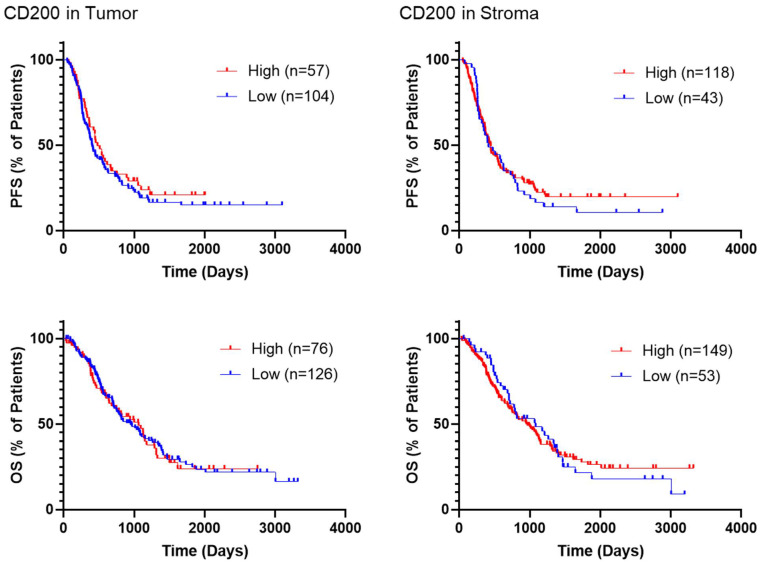
Figure 3.
Survival of patients in YTMA454 based on CD200 expression. Representative Kaplan–Meier curves demonstrate the survival of different groups of patients in YTMA454. The visually determined thresholds of positivity were used as cutpoints to define high- and low-expressing patients for CD200 in both the tumor and stromal compartments. Abbreviations: PFS, progression-free survival; OS, overall survival.

