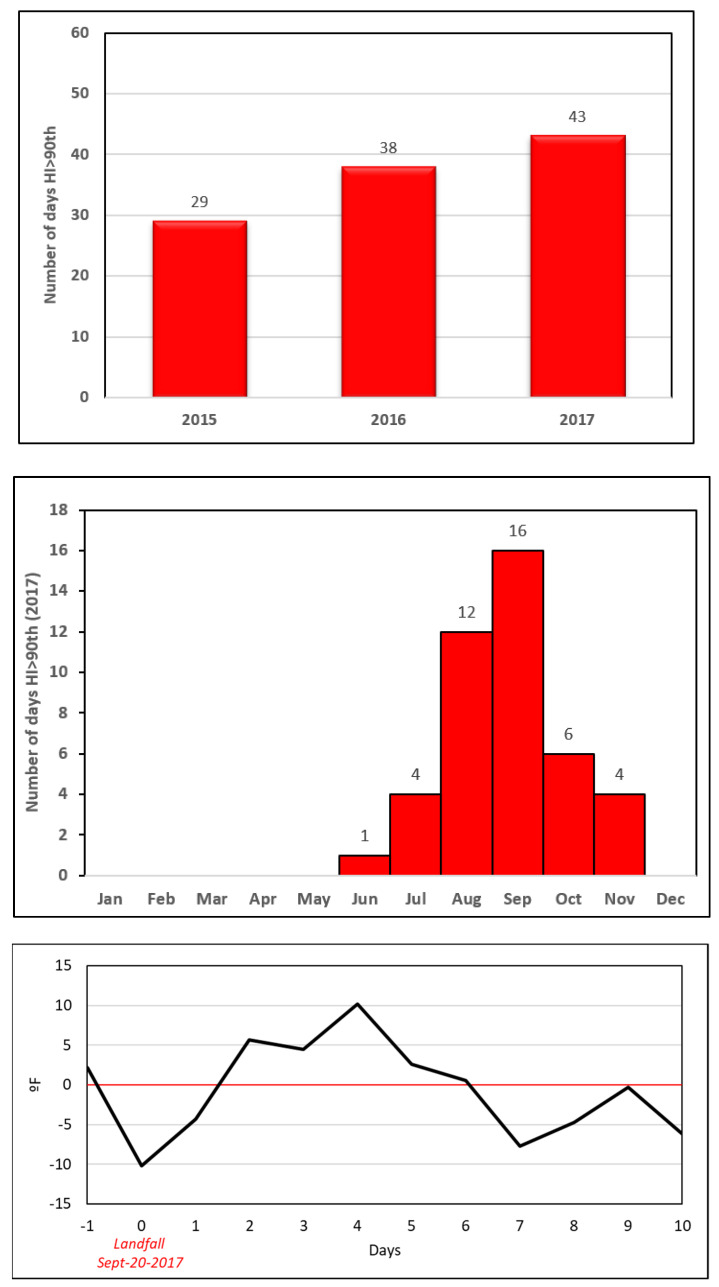
Figure 4.
Upper panel: Number of days with heat index > 90th percentile (38 °C) per recent years. Middle panel: number of days with heat index > 90th percentile (38 °C) per months in 2017. Lower panel: days with heat index “above normal” after landfall. The climate data used in this study are derived from the Daymet version 2 dataset, a 1-km gridded product that provides daily values of precipitation and minimum and maximum temperature interpolated and extrapolated from the Global Historical Climatology daily surface observations [33].

