Figure 1.
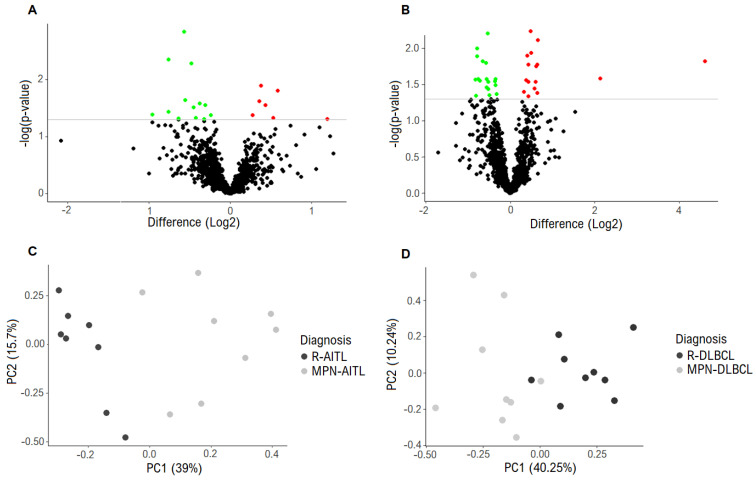
Differentially expressed proteins. (A) Proteomic analysis revealed 20 significantly differentially expressed proteins between the MPN-AITL and R-AITL biopsies. The grey horizontal line marks the threshold of p < 0.05 of significantly expressed proteins. Green: downregulated. Red: upregulated. (B) Proteomic analysis showed 34 significantly differentially expressed proteins between the MPN-DLBCL and R-DLBCL biopsies. The grey horizontal line marks the threshold of p < 0.05 of significantly expressed proteins. Green: downregulated. Red: upregulated. (C) PCA with input of the 20 differentially expressed proteins revealed distinct clustering between the MPN-AITL and R-AITL specimens. Dark grey represents the R-AITL samples and light grey represents the MPN-AITL samples. (D) PCA with input of the 34 differentially expressed proteins showed clustering between the MPN-DLBCL and R-DLBCL specimens, with the exception of two samples. Dark grey represents R-DLBCL samples and light grey represent MPN-DLBCL samples. Abbreviations: AITL, angioimmunoblastic T-cell lymphoma; DLBCL, diffuse large B-cell lymphoma; MPN, myeloproliferative neoplasia; PCA, principal component analysis; R-, reference sample.

