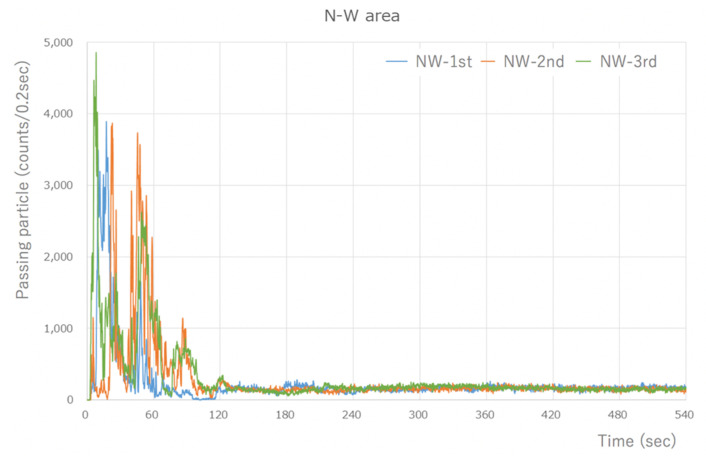
Figure 2.
Type-S measurement results (during visualization of the NW area). A large number of particles were detected, at around 4000 counts/0.2 s, immediately after the start. However, the number of particles that were measured after 1 min of work significantly decreased, and a steady state was reached after 60 s. The results are similar for the other areas.

