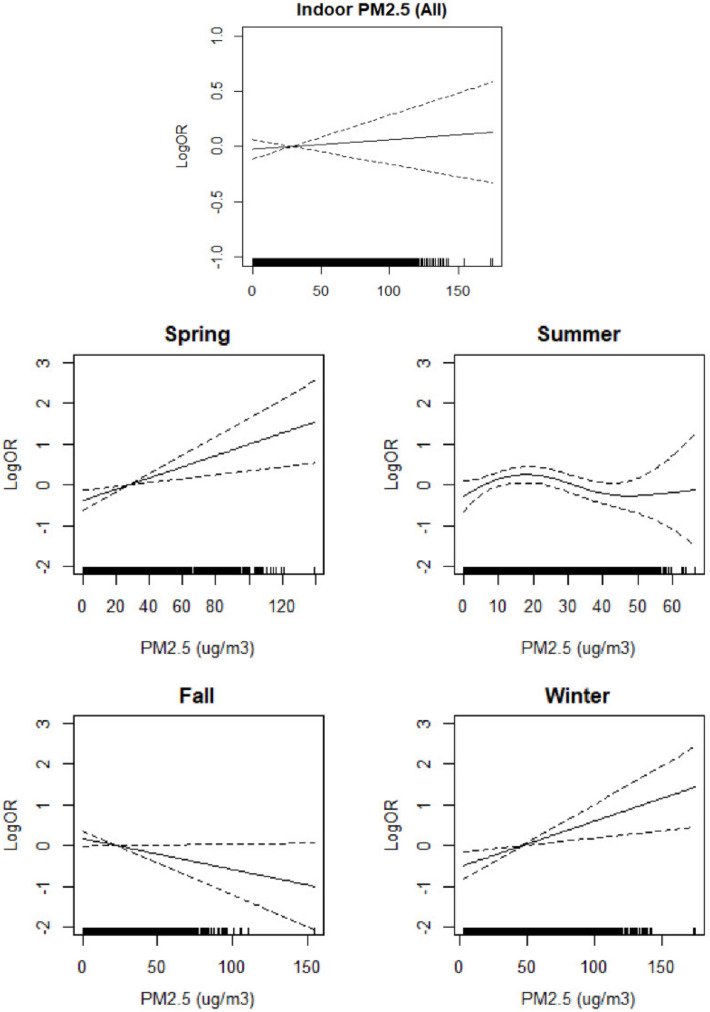
Figure 1.
Relationship of indoor PM2.5 with atopic dermatitis (AD) symptoms. Each figure shows the spline curves (solid lines) with 95% confidence intervals (two dashed lines). The model was controlled for the severity score at the initial visit, age, sex, presence of fever, and day of week (DOW), indoor RH, temperature, and formaldehyde; OR: odds ratio.

