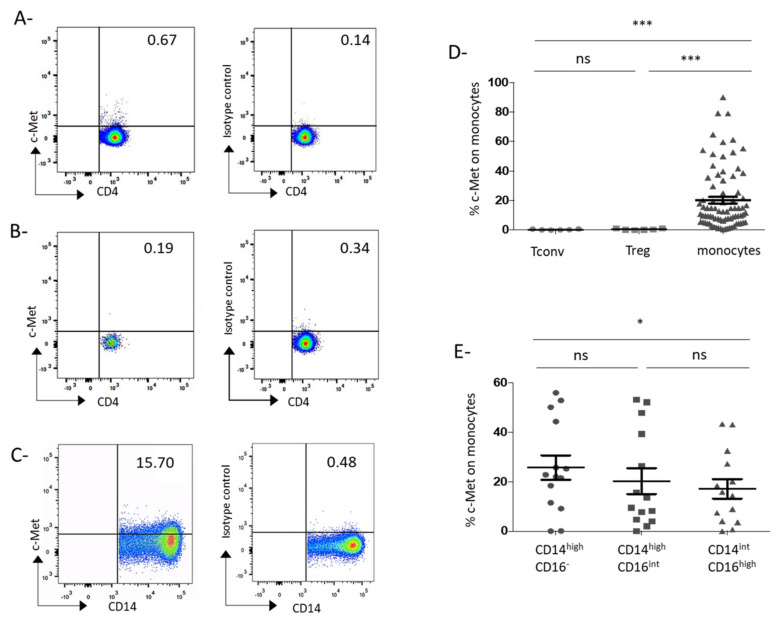
Figure 1.
Circulating monocytes but not circulating conventional or regulatory T cells express the c-Met receptor in GC patients. Freshly isolated PBMCs from GC patients were stained with fluorochrome-conjugated antibodies or their isotype control and analyzed by flow cytometry. Tconv were defined as CD4+/CD25− cells. Treg were defined as CD4+/CD25+/Foxp3+/CD127lowcells. Monocytes were defined as CD14+/HLA-DR+/CD3−/CD56−/CD19− cells. (A–C) Representative c-Met expression by Tconv (A), Treg (B), and monocytes (C) of GC patients. Results are indicated in percentages of c-Met positive cells. (D) Mean c-Met expression by peripheral Tconv (mean ± SEM: 0.36 ± 0.13%; n = 6), Treg (mean ± SEM: 0.55 ± 0.20%; n = 6) and monocytes (mean ± SEM: 20.24 ± 2.32%; n = 80) from GC patients. *** indicates a p-value ≤ 0.001 according the Kruskall-Wallis multiple comparisons test. (E) Mean c-Met expression by the three monocytes subpopulations from GC patients (n = 14): CD14high/CD16− (mean ± SEM: 25.67 ± 4.95%), CD14highCD16int (mean ± SEM: 20.24 ± 5.26%) and CD14intCD16high (mean ± SD: 17.10 ± 3.914%). * indicates a p-value ≤ 0.05 according the Friedman multiple comparisons test. Ns: nonsignificant.

