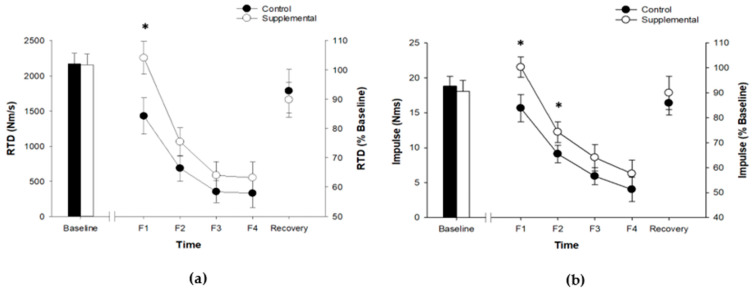
Figure 2.
Rate of torque development during first 400 ms of each MVIC (a); Impulse during the first 200 ms of each MVIC (b). F1–F4 denotes ~10 s time duration when MVIC was performed during and after fatiguing tasks. Values are mean ± SE, presented with both absolute (left axis) and relative (right axis) scales. *—Significant difference between two sessions (p < 0.05).

