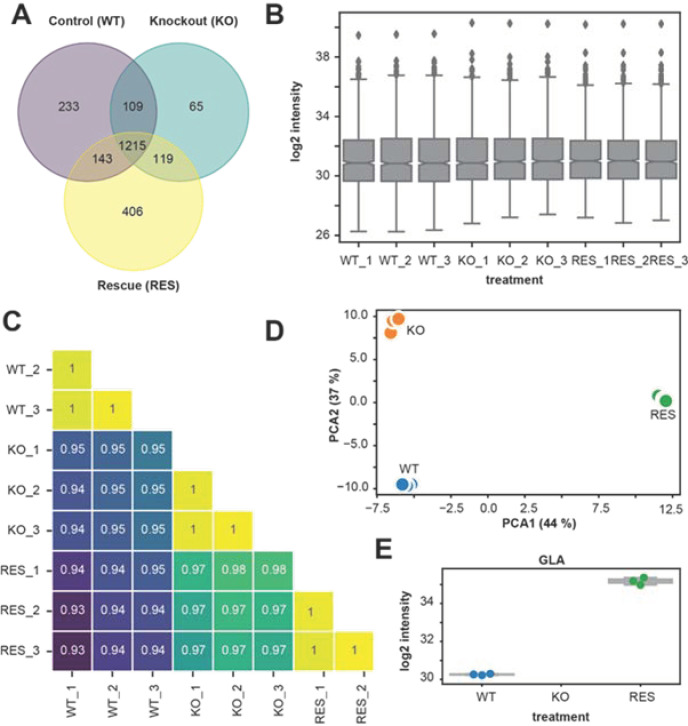
Figure 3.
Comparison of replicates and groups for LC-MS/MS reproducibility. (A) Venn diagram showing the distribution of identified proteins in different groups (wild-type/control (WT)), knockout (KO), and rescue (RES). (B) Boxplots showing the label-free quantification (LFQ) intensities (log2) of all biological replicates. (C) Correlation map of biological replicates for all groups. It shows a high Pearson correlation coefficient of LFQ intensities between replicates of the same group (> 0.99). (D) Principal component analysis (PCA) of biological replicates for all groups. Visualization shows strong clustering between replicates of the same group. (E) log2 intensity of AGAL/GLA-protein for each group and replicates, confirming knockout and rescue.

