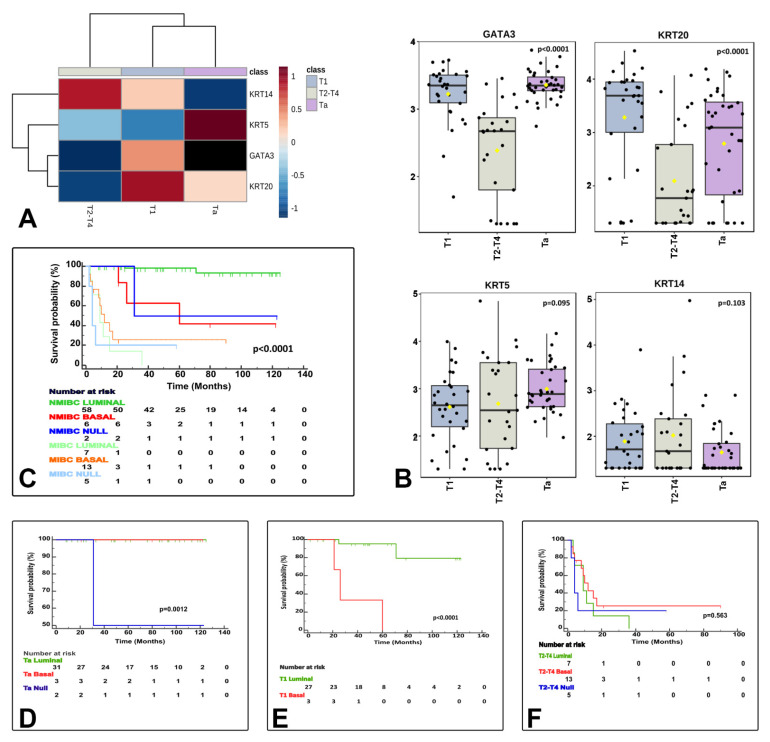
Figure 4.
The three identified molecular subtypes correlate with tumor stage related features. The heatmap shows differentially expressed luminal and basal markers by stage category (A). Box and whisker plots of the normalized values (mean ± SD) illustrate the expression of GATA3, KRT20, KRT5, and KRT14 by stage category (ANOVA test) (B). The Kaplan–Meier plots identified differences for cancer specific survival (CSS) by clinically meaningful categories (NMIBC vs. MIBC) (C) and separately for Ta (D), T1 (E), and T2−4 (F) stage categories.

