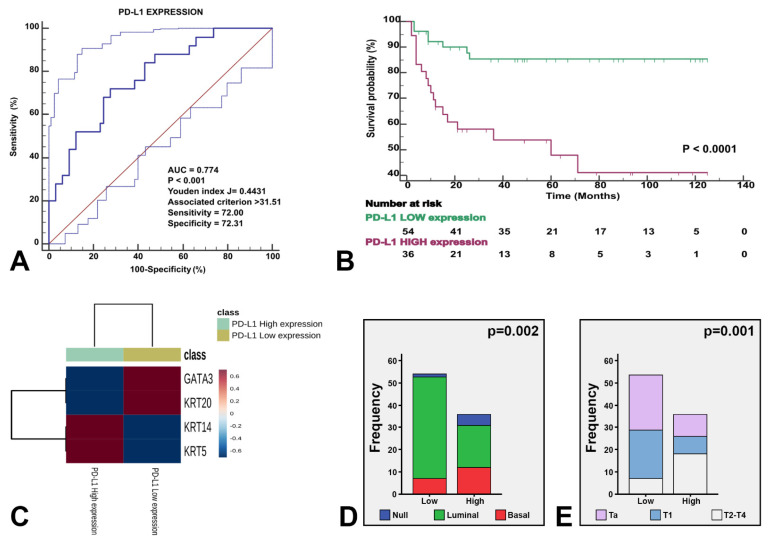
Figure 5.
The three identified molecular subtypes were stratified by PD-L1 expression. Receiving operating characteristics yielded an AUC of 0.774 (p < 0.001) for the optimal cutoff point of PD-L1 expression (A), which illustrated survival differences in our study series (B). The heatmap shows the expression of the four genes stratified by high vs. low PD-L1 expression (C). The enclosed histograms depict differences between high vs. low PD-L1 expression according to molecular subtypes (D) and stage category (E).

