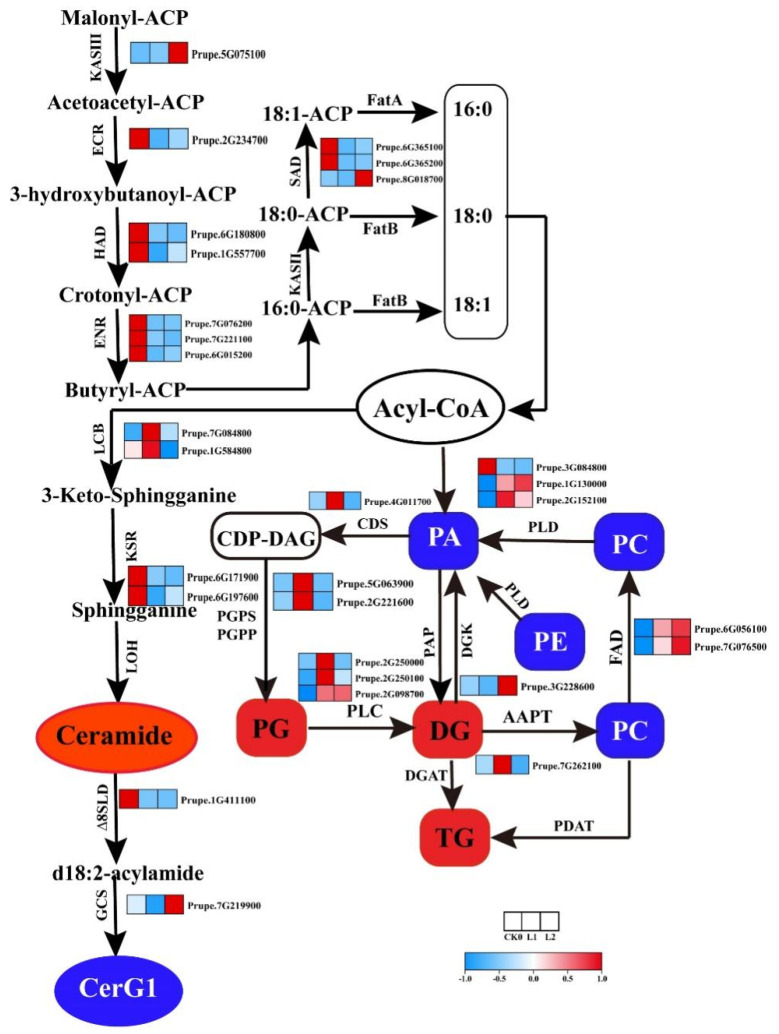
Figure 6.
Expression profiles of genes related to lipid metabolism and fatty acid levels in SH peach fruit. Red boxes and ellipse indicate lipid sub-classes showing a significant increase in content after cold storage; blue boxes and ellipse indicate lipid sub-classes showing a significant reduction in content after cold storage. Red and blue boxes in the heatmap indicate upregulation and downregulation of gene expression, respectively.

