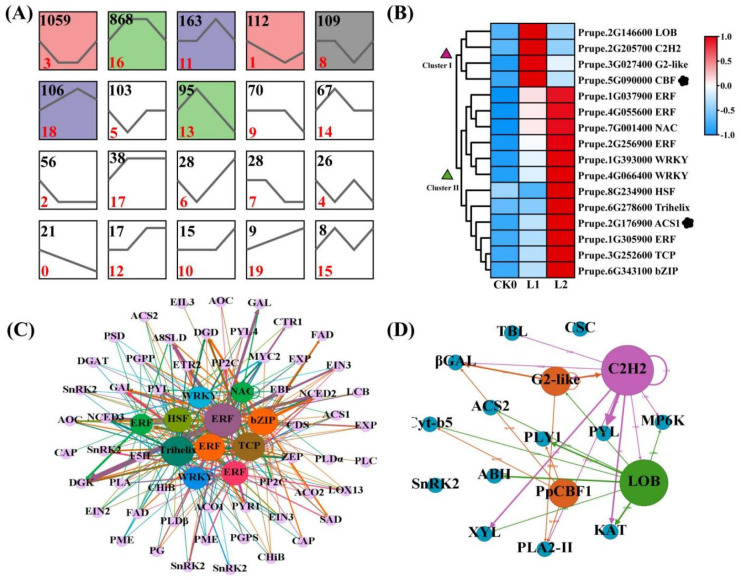
Figure 7.
(A) Clustering of gene expression data. Expression profiles are based on the cluster of genes differentially expressed at low temperatures. Clusters with colored backgrounds have statistically more assigned DEGs than the number expected. The black line in each box represents the extracted expression pattern for each cluster; (B) Heatmap of differentially expressed transcription factor (TF) family members, as well as ACS1 and PpCBF1 genes during SH peach fruit cold storage; (C) Co-expression network comprising cluster Ⅱ TFs and genes related to cell wall modification, lipid metabolism, and phytohormone biosynthesis; (D) Co-expression network comprising clusterⅠTFs and genes related to cell wall modification, lipid metabolism, and phytohormone biosynthesis.

