Figure 3.
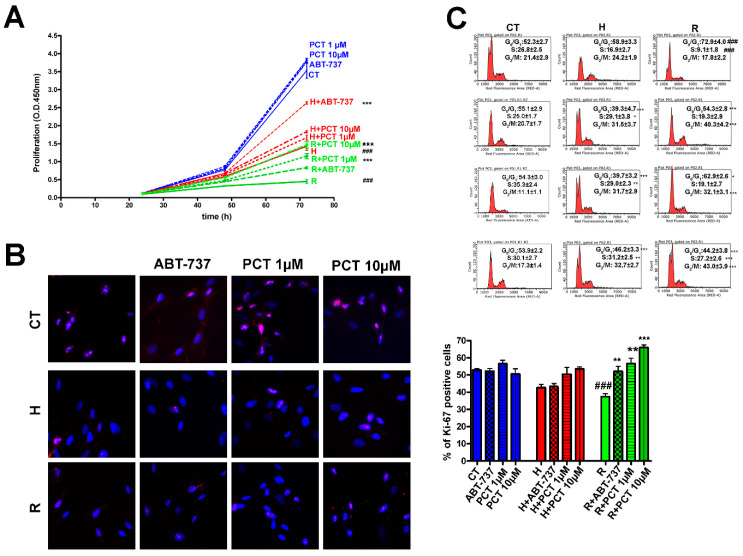
Cell cycle profile and proliferation of cells treated with piceatannol. MSCs at 10 DIV were treated for 30 min with 300 μM hydrogen peroxide to induce acute senescence. After 48 h, senescent cultures were incubated with ABT-737 or piceatannol for another 72 h. Alternatively, MSCs at 30 DIV (i.e., replicative senescent cultures) were incubated with ABT-737 or piceatannol for 72 h. Panel (A) shows the proliferation of healthy cultures (blue lines), acute (red lines) and chronic (green lines) senescent cultures with or without ABT-737 or piceatannol. Data are expressed as 450 nm O.D. The percentage of cycling cells (i.e., Ki67 positive) and the cell cycle flow cytometry charts of cultures treated as described above are reported in Panels (B,C), respectively. In Panel (B), the pictures show representative images of Ki67 staining (i.e., in red) in control cultures at 10 DIV (CT), in 10 DIV samples treated with hydrogen peroxide (H), and in replicative senescent cultures at 30 DIV (R). The chart on the right shows the percentage of Ki67(+) cells in healthy cultures (CT) treated with ABT-737 or PCT (blue bars), in peroxide hydrogen treated cultures (red bars) and in replicative senescent cultures (green bars). Statistical data are shown with standard deviation (SD) n = 3. In panel (B,C) the *** p < 0.001, ** p < 0.01 and * p < 0.05 levels are statistical significances between control and samples with piceatannol or ABT-737. In panel (B,C), the ### p < 0.001 are statistical significances between control (CT) and peroxide hydrogen-treated samples (H) or replicative senescent cultures (REP). In the panels, the statistically significant values refer to 72 h treatments.

