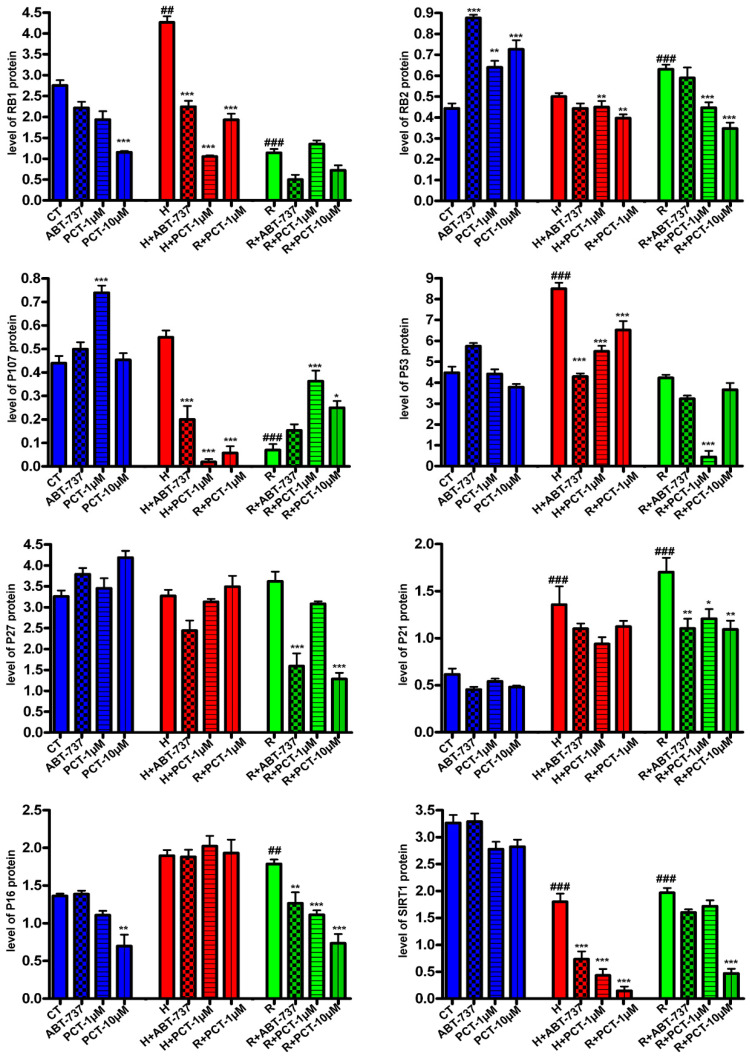
Figure 5.
Signaling pathways associated with senescence and the effect of piceatannol treatment. The charts show the expression of RB1/P105, RB2/P130, P107, P53, P27/KIP1, P21/CIP1, P16/INK4A and SIRT1 in control samples (CT) and in samples treated with hydrogen peroxide (H) or in replicative senescence cultures (R). The charts show the densitometric analysis of Western blot bands shown in Supplementary file S3. The expression of proteins of interest was normalized on GAPDH, chosen as the control. The ### p < 0.001 and ## p < 0.01 levels indicate statistical significance between the control and senescent samples. The *** p<0.01 ** p < 0.01 and * p < 0.05 indicate statistical significance between the control samples and samples treated with piceatannol or ABT-737.

