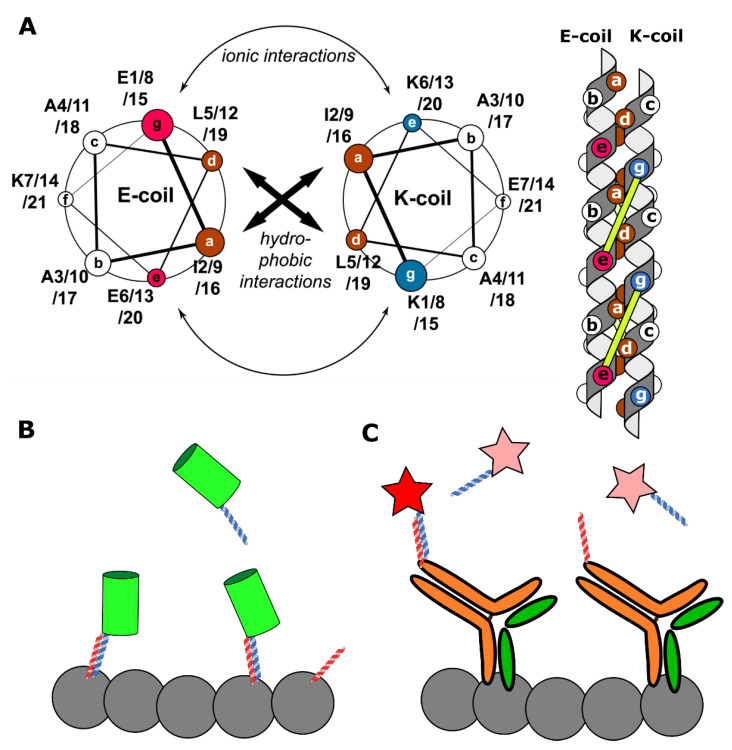
Figure 4.
A schematic representation of K/E-coils labeling systems. (A) Left: a helical wheel diagram, demonstrating the amino acid residues in interacting helices (reprinted by permission from Springer Nature Customer Service Centre Gmbh: Springer Nature Cellular and Molecular Life Sciences, Perfilov et al. [21], Copyright Clearance Center (2020)). Heptad positions are labeled with a–g. Brown positions show hydrophobic amino acid residues, purple—positively charged residues, and blue—negatively charged residues. Right: a schematic side view representation of a coiled-coil complex. Circles on helices show amino acid residues from the helical wheel diagram. The complex is stabilized both by hydrophobic interactions between a and d positions and ionic interactions between residues i (position g) of one helix and residues i + 5 of the other helix (position e). Ionic interactions are represented by yellow lines. (B) The KECs approach. Target proteins (grey circles) are tagged by E-coils (red helices). K-coils (blue helices) are bound to fluorescent proteins (green cylinder). Reversible interaction between K- and E-coils makes possible target proteins visualization. In contrast, in the peptide-PAINT approach (C) E-coils are conjugated to target-specific antibodies and K-coils are Cy3B labeled. Similar to the DNA-PAINT, labels are only visible (red star) when a coiled-coil complex is formed, while unbound labels are undetectable (pink stars) [108].

