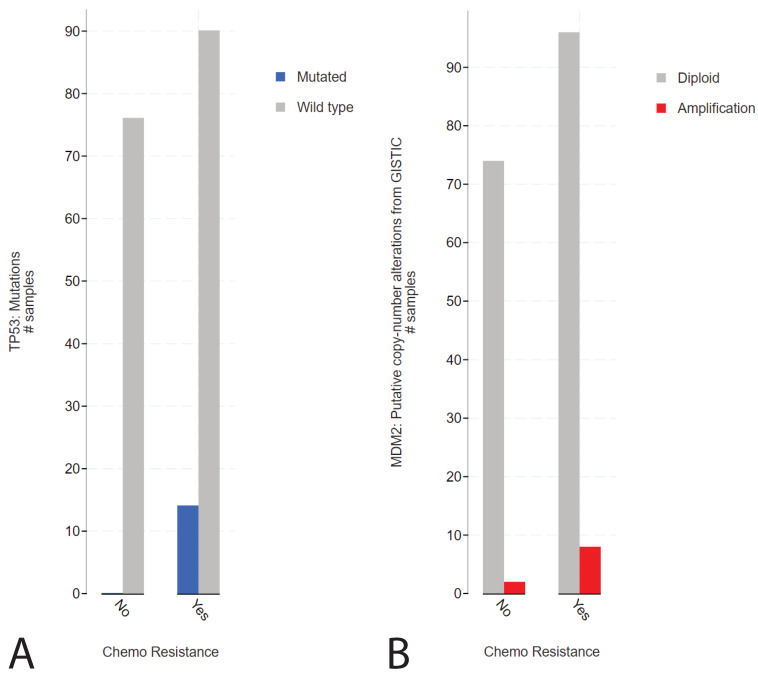
Figure 1.
cBioPortal analysis of the tumor resistance in TP53- or MDM2-altered patients in the MSKCC, J Clin Oncol 2016 data set. (A) Bar graph displaying the number of patients with sensitive or resistant cisplatin, patients harboring wild-type (grey) or mutated (blue) TP53 are plotted. (B) Bar graph displaying the number of patients with sensitive or resistant cisplatin, patients harboring wild-type (grey) or amplified (red) MDM2 are plotted [9,24,25].

