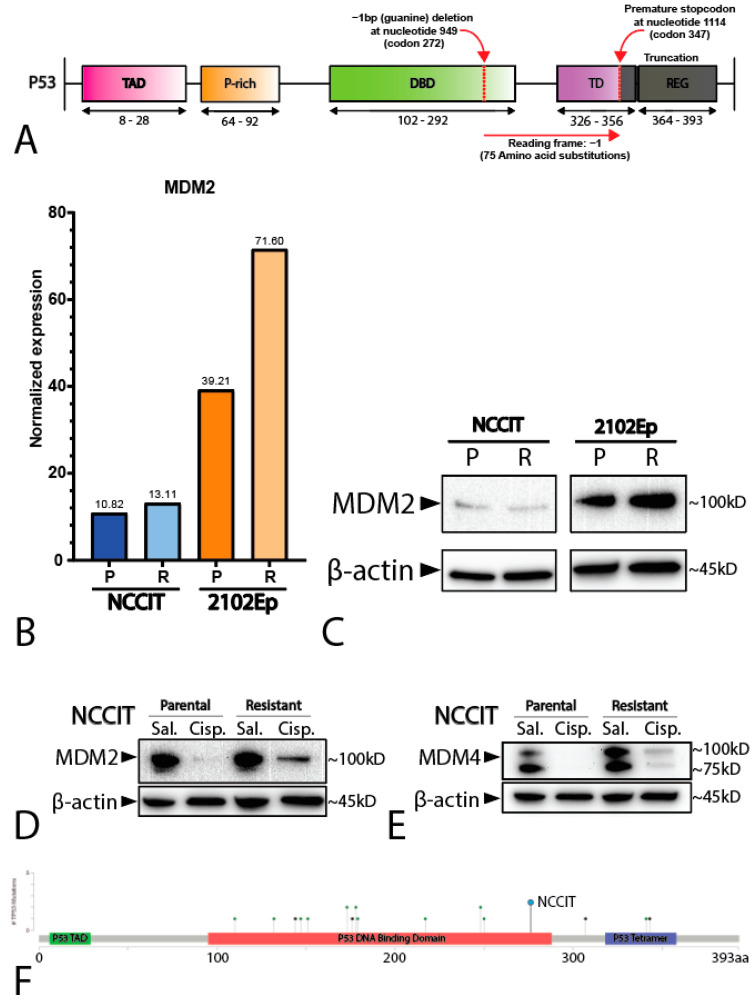
Figure 2.
Characterization of the cell lines NCCIT and 2102Ep. (A) Schematic overview of the hemizygous mutation present in the NCCIT cell line. (B) Bar graph displaying the normalized expression (RNA-seq) of MDM2 in the NCCIT and 2102Ep parental and resistant cell lines. (C) Western blot showing the protein levels of MDM2 in the NCCIT and 2102Ep parental and resistant cell lines. (D,E) Western blot displaying the MDM2 (D) and MDM4 (E) protein levels after treatment with sublethal cisplatin doses (1 µM) or saline vehicle control. (F) Mutational position of TP53 mutations in patients in the MSKCC, J Clin Oncol 2016 data set. The mutation found in NCCIT is highlighted with a blue dot.

