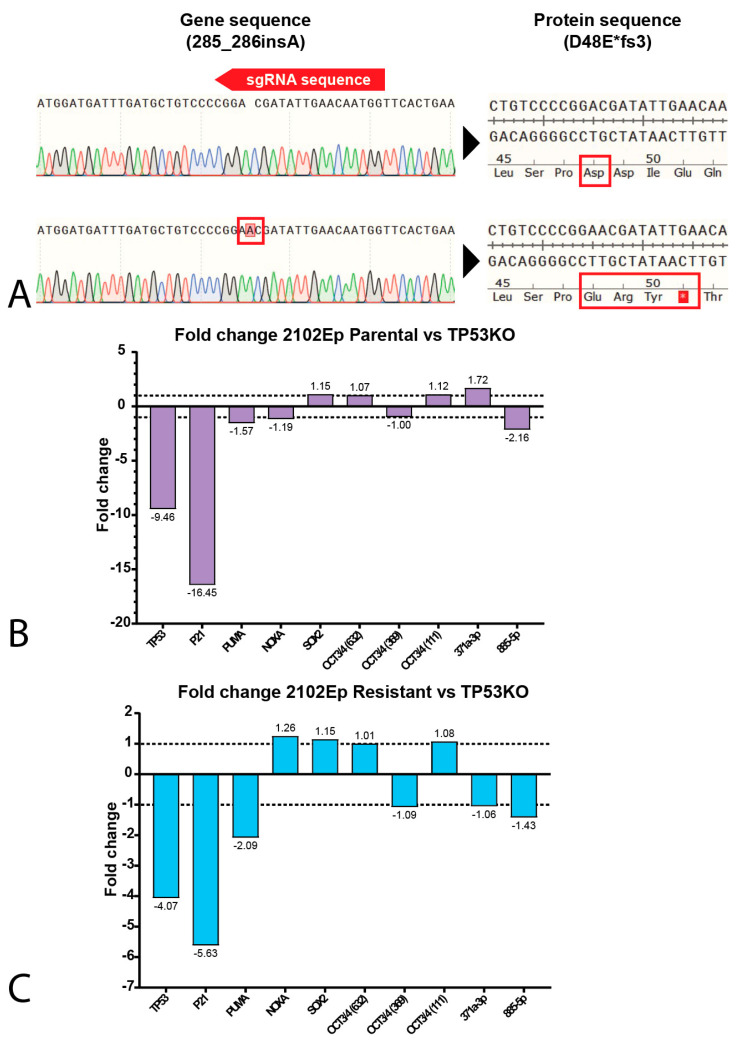
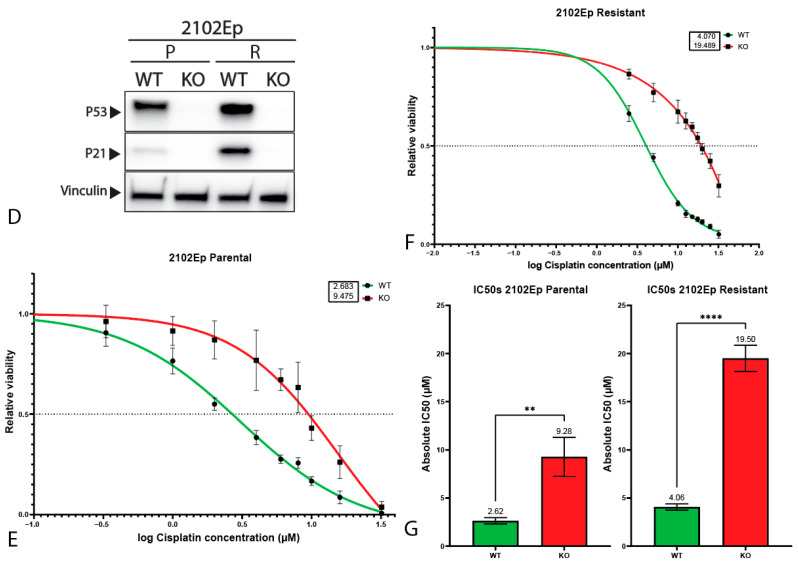
Figure 3.
Characterization of 2102Ep TP53 knock-out cell lines. (A) SnapGene genome sequence alignments of the CRISPR/Cas9 target site of the TP53 gene. The knock-out cell line (bottom sequence) shows a one-base-pair insertion (A) at amino acid 49, resulting in a premature STOP codon at amino acid 51. (B,C) Bar graphs showing the fold change in expression between 2102Ep parental cell line and its isogenic TP53 knock-out clone (B) or 2102Ep-resistant cell line and its isogenic TP53 knock-out clone (C). (D) Western blots showing the protein levels of P53, P21 and vinculin (as loading control) in 2102Ep parental and resistant cell lines and their isogenic TP53 knock-out clones. (E,F) S-curves showing the viability of the parental (E) and resistant (F) 2102Ep cell lines and their corresponding knock-out when treated with cisplatin for 72 h. Graphs represent three biological replicates with three technical replicates each. (G) Bar plots displaying IC50 values of all 2102Ep cell lines. Both cell line pairs show significant differences in IC50 values after knock-out (parental p = 0.0049, resistant p ≤ 0.0001, unpaired Student’s t-test). Mean ± SD: 2102Ep parental 2.62 ± 0.33, 2102Ep parental TP53 KO 9.28 ± 2.02, 2102Ep resistant 4.06 ± 0.32, and 2102Ep resistant TP53 KO 19.50 ± 1.36. Graphs represent three biological replicates with three technical replicates each. ** p ≤ 0.01, **** p ≤ 0.0001.


