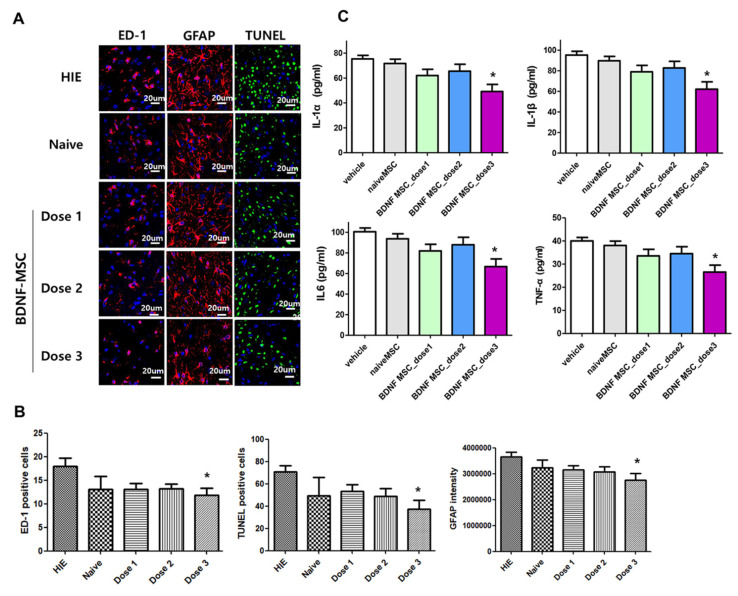
Figure 6.
Brain tissue injury including inflammation, cell death, and reactive gliosis after hypoxic ischemic injury and MSC transplantation. (A) Representative immunofluorescence photomicrographs of the penumbra area with staining for ED1 (red), glial fibrillary acidic protein (GFAP) (red), TUNEL (green), and 4′,6-diamidino-2-pheylindole (DAPI) (blue) in the brains at 5 weeks after modeling. (B) The average number of ED1-positive cells, TUNEL-positive cells, and mean light intensity of GFAP, DCX, and MBP immunofluorescence per high-power field (HPF) in each group. (C) Levels of inflammatory cytokines including IL-1α, IL-β, and IL-6 and TNF-α in total brain tissue homogenates at 5 weeks after modeling. Data are expressed as mean ± standard error of the mean. * p < 0.05 compared to the HI + vehicle control. Abbreviations: vehicle, HI + vehicle control, naïve MSCs; HI + naïve MSCs, BDNF MSC_dose1; HI + BDNF-eMSCs at 1 × 10⁴ cells dose; BDNF MSC_dose2; HI + BDNF-eMSCs at 5 × 10⁴ cells dose; BDNF MSC_dose3; HI + BDNF-eMSCs at 1 × 10⁵ cells dose.

