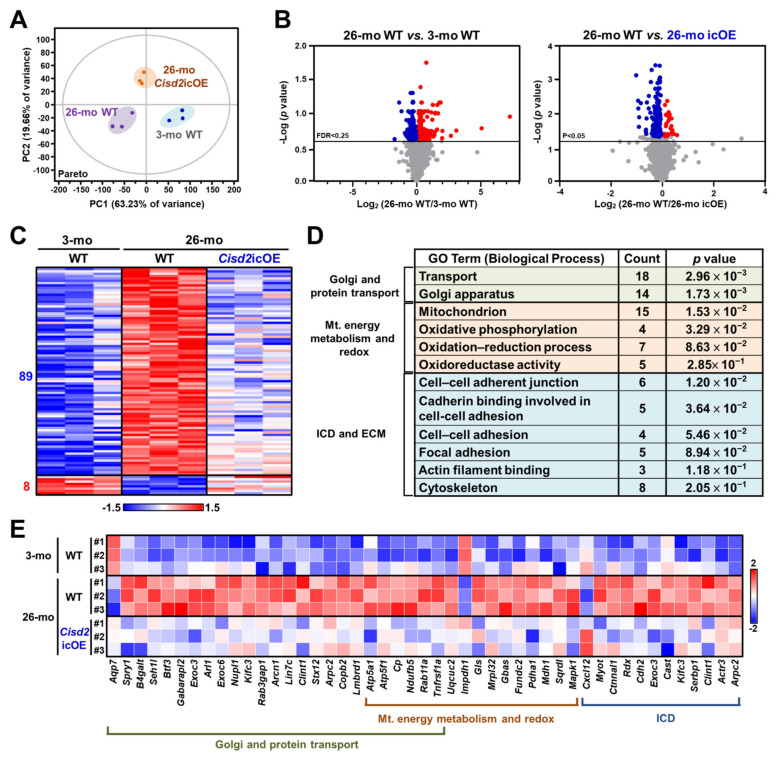
Figure 4.
Cardiac-specific overexpression of Cisd2 at late-life stage in Cisd2 icOE mice reverses the cardiac transcriptomic profile changing it from an old-age pattern to a younger pattern. (A) Principal component analysis (PCA) of the RNA-seq data from the three groups of mice, namely 3-mo WT, 26-mo WT, and 26-mo Cisd2 icOE. (B) Volcano plots representing the transcriptomic changes in the 26-mo WT vs. 3-mo WT mice and in 26-mo WT vs. 26-mo Cisd2 icOE mice. The horizontal lines show the 25% false discovery rate (FDR) or the p < 0.05 threshold. Blue dots indicate the downregulated genes and red dots indicate the upregulated genes. (C) Heatmap showing the 97 differently expressed genes (DEGs) that are reverted by the cardiac-specific overexpression of Cisd2 in the Cisd2 icOE mice. (D) Analysis of the Cisd2-reverted DEGs by the GO Biological Processes. (E) Heatmap showing the DEGs involved in Golgi and protein transport, mitochondrial (Mt.) energy metabolism and redox, and ICDs and ECM. ICD, intercalated disc; ECM, extracellular matrix.

