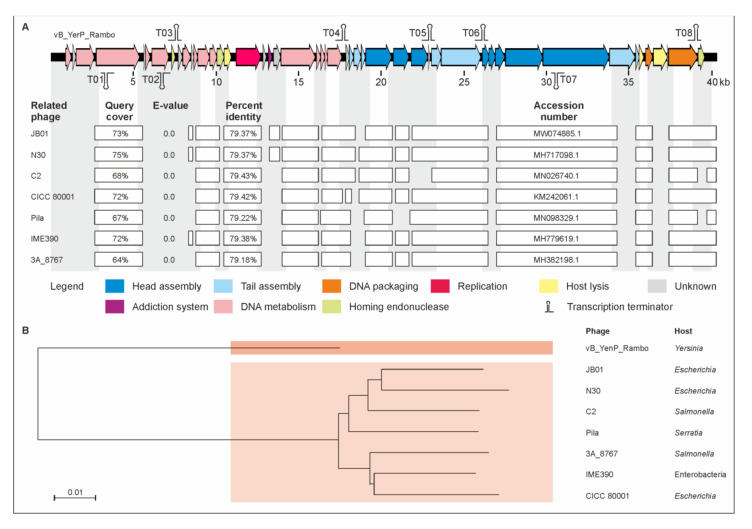
Figure 2.
Gene map of phage vB_YenP_Rambo and its relationship to other podoviruses. (A) Gene map of the phage and identity values with other phages. White bars represent regions of high nucleotide similarity (>75%). (B) Phylogenetic tree (single nucleotide polymorphism (SNP)-based) of the phages. The scale bar represents the number of nucleotide substitutions per site.

