
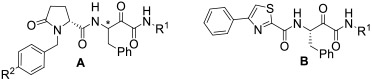
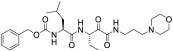
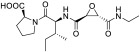
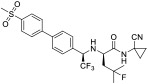
Table 1.
Potency and selectivity of the new α-ketoamides 1a-j, AK-295, CA-074, odanacatib, and E-64c.
| |||||||
|---|---|---|---|---|---|---|---|
| ID | Scaffold | Structure | Calpain-1 | % Inhibition at 1 μM | |||
| % Inhibition at 1 μM |
IC50 (μM) | CatB | CatK | Papain | |||
| 1a | A | R1 = Et, R2 = H; *(S) | 84.2 | 0.27 ± 0.03 | 0 | 5.6 | 0 |
| 1b | A | R1 = Et, R2 = F; *(S) | 85.2 | 0.38 ± 0.03 | 0 | 8.3 | 16.3 |
| 1c | A | R1 = 4-F-Bn, R2 = H; *(S) | 98.1 | 0.078 ± 0.01 | 11.4 | 13.5 | 15.2 |
| 1d | A | R1 = 4-F-Bn, R2 = F; *(S) | 96.7 | 0.14 ± 0.02 | 14.2 | 10.4 | 27.3 |
| 1e | A | R1 = cyclo-Pr, R2 = H; *(S) | 86.7 | 0.52 ± 0.10 | 13.2 | 4.1 | 2.9 |
| 1f | A | R1 = 3-butynyl, R2 = H; *(S) | 76.4 | - | 31.8 | 4.2 | 0 |
| 1g | A | R1 = 4-F-Bn, R2 = H; *(R) | 31.8 | - | - | - | - |
| 1h | A |

|
70.5 | - | - | - | 12.2 |
| 1i | B | R1 = Et | 2.0 | - | 11.5 | 7.3 | 2.6 |
| 1j | B | R1 = 4-F-Bn | 3.0 | - | 0 | 5.6 | 11.7 |
| AK-295 |
|
100 | - | 18.0 | 100 | 18.7 | |
| CA-074 |
|
4.72 | - | 100 | 70.5 | 16.8 | |
| odanacatib |
|
7.10 | - | 57.2 | 99.8 | 14.7 | |
| E-64c |
|
86.0 | - | 99.3 | 100 | 97.6 | |
[a]
Dose-response studies were conducted to determine IC50 values for those compounds that showed more than 80% inhibition at 1 μM concentration, IC50 values were calculated by four-parameter dose-response curve-fitting in GraphPad Prism. The results are from three replicates. Percent inhibition errors are estimated to be <10%; IC50 data are presented as mean ± SD.