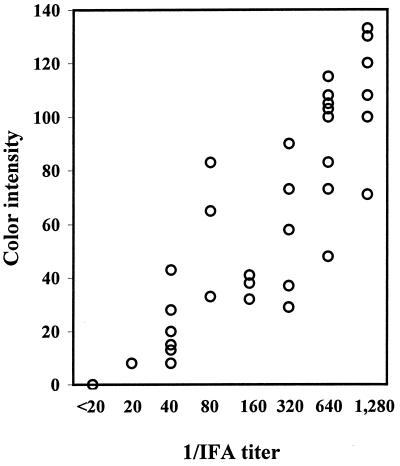
FIG. 4.
Correlation between IFA titer (reciprocal dilution) and color intensity of dot blot reactions of sera, except for three sera in group I. The color intensities of each dot in Fig. 3 were determined and plotted. Each circle represents one sample. The correlation coefficient was 0.913 (P < 0.001; n = 54).

