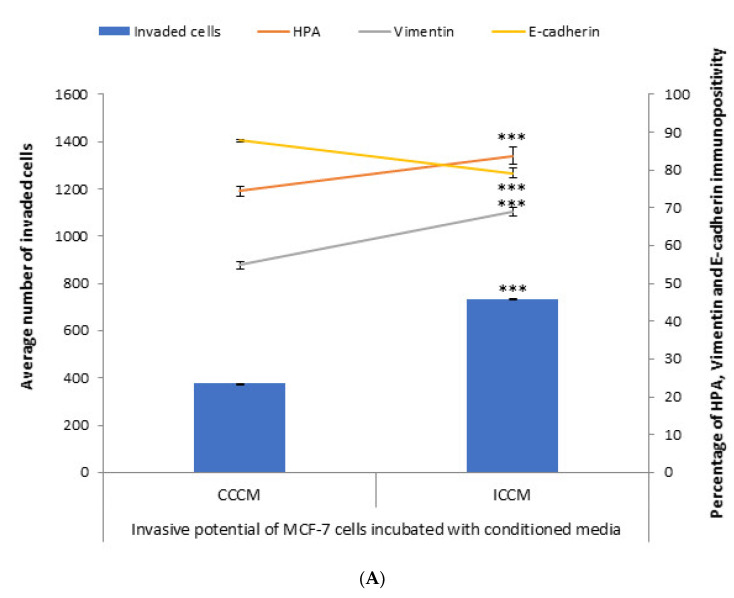
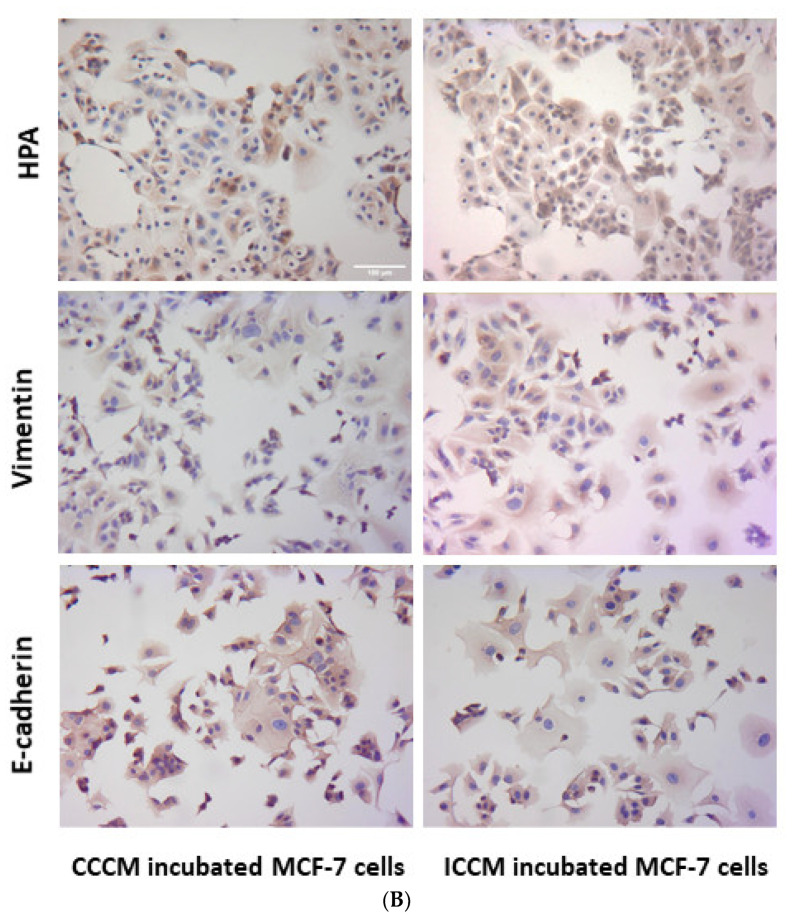
Figure 1.
Invasive potential of MCF-7 cells shown by Matrigel invasion assay, glycosylation and EMT characteristics following 24 h CCCM or ICCM transfer. (A) The data presented as a mean of a total number of invaded cells, and the percentage of HPA labelling and EMT markers (vimentin and E-cadherin) positive cells. The error bars represent the SEM of invaded cells and the percentage of HPA and EMT markers of 3 independent experiments (*** p ≤ 0.0001); (B) Representative images for HPA labelling and EMT markers (vimentin and E-cadherin) assays in CCCM or ICCM incubated MCF-7 cells. Scale bar: 100 μm.


