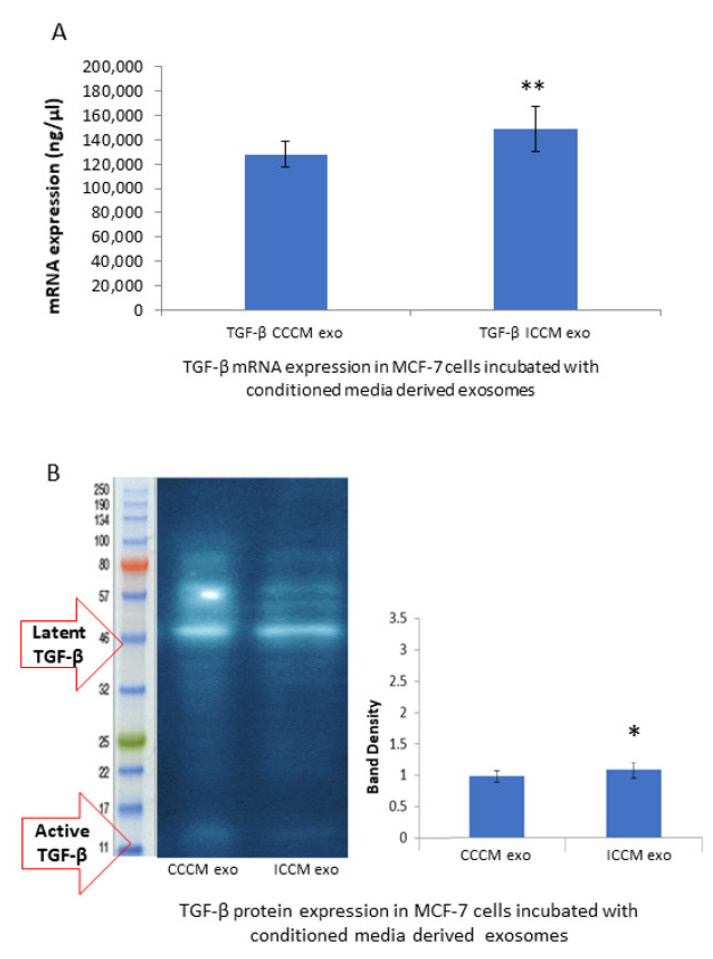
Figure 7.
Comparison of TGF-β expressions at the mRNA and protein levels in the MCF-7 cells incubated either with CCCM or ICCM exosomes. (A) qPCR analysis showing TGF-β expression in MCF-7 cells. The error bars represent SEM of the mRNA expression. Experiment was carried out in triplicate. (B) Representative Western blot analysis image shows latent (44 kDa) and active (12.5 kDa) TGF-β expressions in MCF-7 cells. Bar diagram shows the TGF-β protein expressions measured as band density. The error bars represent the SEM of protein expressions of three independent experiments (* p ≤ 0.05, ** p ≤ 0.001).

