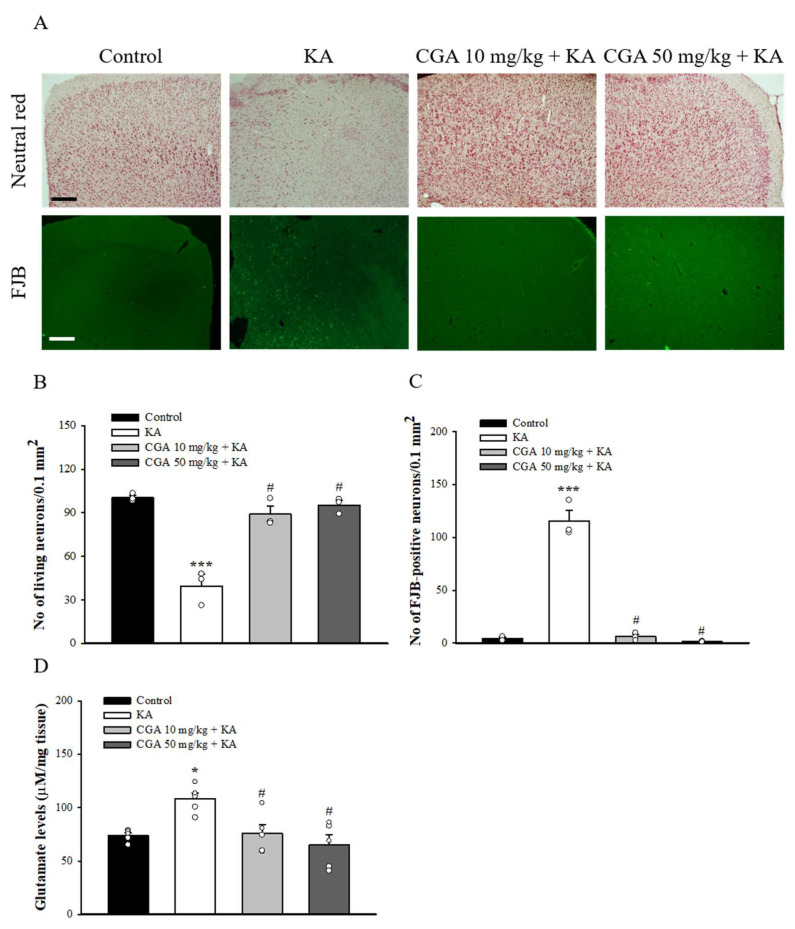
Figure 7.
Effect of CGA pretreatment on the neuronal cell death and glutamate levels in the cortex of rats with KA. (A) Representative images of neutral red and FJB staining at 3 d after i.p. KA. (B, C) Quantitative data of A showing the number of living neurons and FJB-positive cells in the cortex. (D) The effect of CGA on the concentration of glutamate in the cortex. Data are presented as mean ± SEM. (n = 3–5 rats for each group). *, p < 0.05, ***, p < 0.001 vs. control group. #, p < 0.05 vs. KA group. Scale bar: 400 μm.

