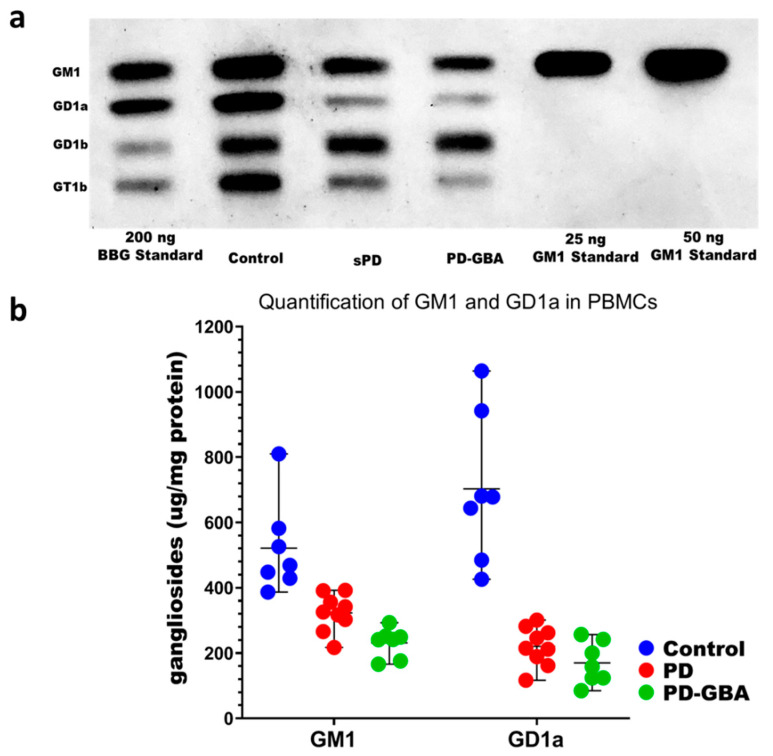
Figure 1.
Detection and quantification of GM1 and GD1a in PBMCs. (a) Image of autoradiographic film depicting HPTLC separation and CtxB-HRP detection of GM1, GD1a and other ganglio-series following N’ase treatment. (b) GM1 and GD1a are shown as the mean and range of levels by upper and lower lines for PBMCs from seven healthy controls, nine sPD, and seven PD-GBA patients. One-way ANOVA revealed a significant difference in GM1 between controls and the other two groups: F(2, 20) = 19.45, p < 0.0001. Tukey’s HSD post-hoc testing revealed that sPD and PD-GBA patients both had significantly less GM1 than healthy controls (p = 0.0008 and p < 0.0001 resp.). One-way ANOVA revealed a significant difference in GD1a between controls and the other two groups: F(2, 20) = 33.81, p < 0.0001. Tukey’s HSD post-hoc testing revealed that sPD and PD-GBA patients both had significantly less GD1a than healthy controls (p < 0.0001 for both). Additionally, PD-GBA patients had lower amount of GM1 (p = 0.13) and GD1a (p = 0.74) compared to sPD patients, though these were not significant.

