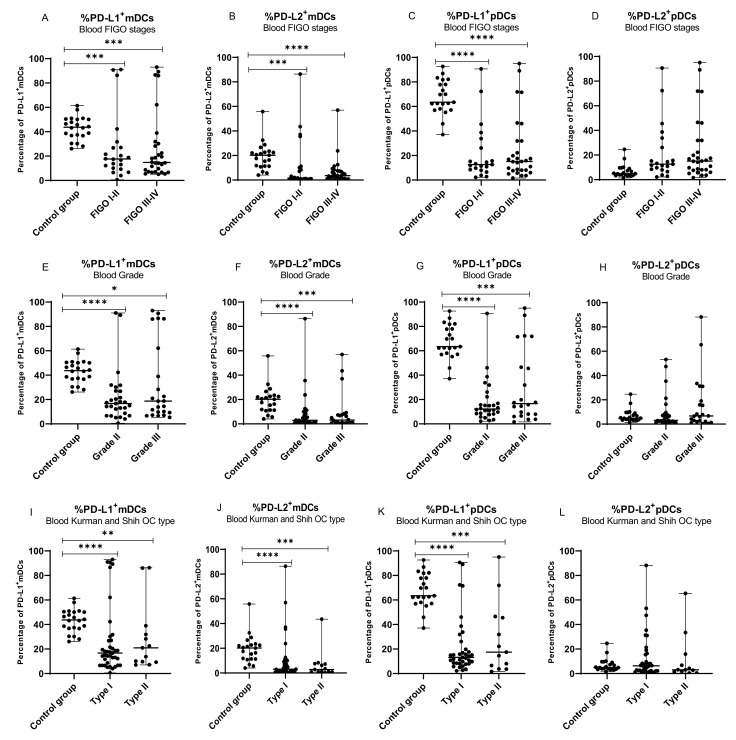
Figure 4.
Distribution of mDCs and pDCs with PD-L1 and PD-L2 expression in peripheral blood of healthy blood donors and peripheral blood of ovarian cancer patients with different FIGO stages (A–D), grade (E–H), and OC types (I–L). The median value with the following marks indicate statistically significant differences: * p < 0.05, ** p < 0.01, *** p < 0.001, **** p < 0.0001.

