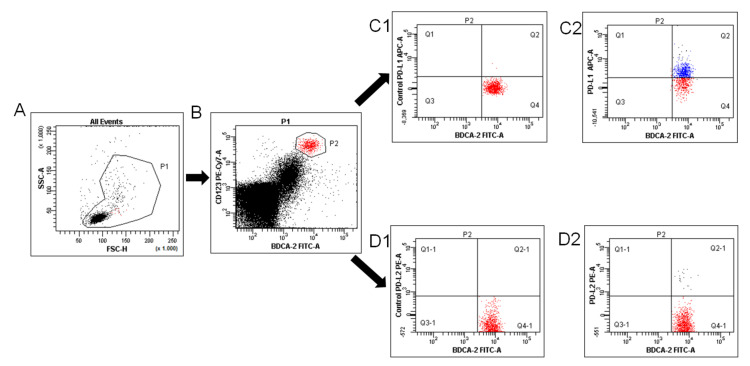
Figure 13.
Flow cytometric analysis of BDCA-2+CD123+PD-L1+ and BDCA-2+CD123+PD-L2+ dendritic cells in the PF of ovarian cancer patients. An acquisition gate was established based on FSC and SSC that included mononuclear cells (P1 population; (A)). Next, the P1 gated MNCs were analyzed for BDCA-2+CD123+ (P2 population; (B)). The final dot plots of PD-L1 pDCs (region Q2, (C2)) or PD-L2 positive BDCA-2+CD123+ cells (region Q2-1, (D2)). Fluorescence minus one (FMO) control ((C1,D1), respectively) was used to verify the staining specificity and as a guide for setting the markers to delineate positive populations.

